A valuable feature in the Tektronix MDO 3000 Series oscilloscopes is the spectrogram, which lets users view in an unusual way aspects of high-frequency signals that may not otherwise be apparent. We’ll use some waveforms synthesized by the internal arbitrary function generator (AFG), a useful option that is incorporated in the MDO3104 oscilloscope.
To get a spectrogram, the scope applies a Fast Fourier transform to a signal to separate the frequencies and amplitudes of its component waves. The result is then displayed as degrees of amplitude (represented hot color to cool color, as in orange = high energy, blue = low energy), at frequencies displayed on the horizontal axis and time displayed on the vertical axis.
Depending on the size of the Fourier analysis window, it is possible to display different levels of frequency/time resolution. A long window resolves frequency at the expense of time to yield a narrow-band spectrogram revealing individual harmonics. A short analysis window can’t distinguish adjacent harmonics but gives better time resolution. The result is a wide-band spectrogram.
For this demonstration, we connect AFG signals to the radio frequency (RF) input. To do this, we connect a BNC cable in the usual way to the AFG output on the back panel. With the other end of the BNC cable temporarily connected to Analog Channel One input, press Waveform and set it to Sine. Then press Waveform Settings. The default frequency is 100 kHz. We want to set the frequency as high as possible. The upper limit for this waveform is 50 MHz. Use the keypad to set the frequency at that level. Pressing Autoset will make the display more readable.
Then, swing the BNC cable over to the RF port. This requires an RF adapter. Press RF to obtain a frequency domain display of the 50 MHz sine wave. Next, twice press the soft key corresponding to the bottom menu item, R to Center. This puts the fundamental frequency at the center of the screen, where it is more readable. Notice that the sine-wave frequency domain display consists of one strong spike at the fundamental. Any harmonics are due to distortion in the BNC cable and terminations.
Next, press RF to bring up the RF menu below the display. Press the soft key associated with spectrogram and, using the top menu on the right, toggle the spectrogram display on. A split screen shows the spectrogram at the top and the frequency-domain display in the bottom half of the screen.
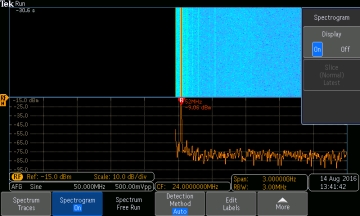
The spectrogram begins at the bottom and slowly moves to the top. One might think it is slowly loading but actually the slow progression is because the Y-axis now corresponds to time. The X-axis is frequency, so the single strong fundamental coincides with the spike in the frequency domain. Because both axes are in use, amplitude must be shown in some other way. This takes place through use of color. Orange corresponds to high amplitude, registered as power, and blue corresponds to low amplitude. To illustrate, temporarily disconnect the BNC cable from the RF port. The orange bar disappears, starting at the bottom and receding into the past until it disappears altogether, at which point the spectrogram display is all blue, representing zero amplitude.
Reconnecting the BNC cable, we see the frequency domain representation of the sine wave instantly appears and the corresponding spectrogram representation begins anew its progress along the temporal Y-axis.
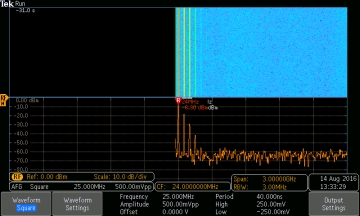
Next, consider the same split-screen representation of the square wave. Again go into Waveform Settings and increase the frequency to the maximum level, which for the square wave is 25 MHz. Returning to the frequency domain, we see prominent harmonics, which appear as progressively smaller spikes, indicating less amplitude as we go farther in frequency from the fundamental.
Once again finding the Spectrogram Menu and toggling it on, notice the vertical bars that represent discrete harmonics. They move at a steady rate upward from the zero point on the Y-axis, corresponding to the passage of time. Also, moving away from the fundamental, the amplitude decreases as denoted by color. It gradually becomes blue and blends in with the background. This blue background is not an absolutely pure hue, but has a noticeable grainy appearance, which represents the noise floor. In the frequency domain view below, this is a rapidly moving irregular line.
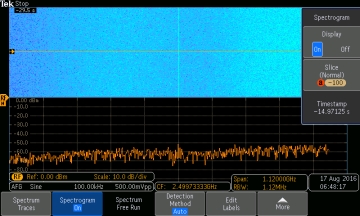
A look at the Spectrogram Menu on the right, just below the Display On/Off control, reveals a menu item labeled Slice (Normal) Latest. This is grayed out, meaning it is not applicable. To make it active, stop the acquisition by pressing the Run/Stop button. This causes the frequency domain representation to stop all activity and, as you would expect, the spectrogram display no longer moves upward. Slice is not now grayed out. There is a timescale associated with it, and this is controlled by Multipurpose Knob a. First press Slice. Then turn Multipurpose Knob a clockwise. A horizontal line moves upward, defining various points along the Y-axis, representing time.
Whenever a new time slice is defined, the corresponding frequency domain graph is adjusted to correspond to the applicable instant in time. This is useful when searching for anomalies, where the frequency distribution is wanted.
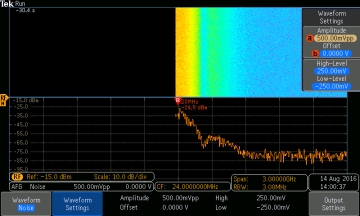
Now consider the noise waveform spectrogram. Hit Default Setup once more. This shifts Stop back to Run and takes us out of RF territory. Pressing AFG, we can then press Waveform and move down to Noise. It is not displayed because the BNC cable is currently connected to RF, not an analog channel input. Now press RF, turn on Spectrogram and Frequency Span. Press R-to-Center twice to get a better display. R-to-Center may not seem to work no matter what you do, until you discover it must be pressed twice, like double-clicking a mouse. As usual, the spectrogram display starts at the bottom, 0 on the Y-axis and moves to the top with the passage of time.
To bring the Waveform up to 100% intensity, we must toggle out of Fine and turn Multipurpose Knob a clockwise. This has to be done frequently because anytime the machine is defaulted, the waveform intensity drops down to 35%.
Noise is quite an interesting signal. Ordinarily, it is extremely broadband. That is why it can be reduced by limiting the oscilloscope bandwidth. In the noise signal as synthesized in the Tektronix MDO 3000 series built-in AFG, there is a lot of amplitude in frequencies adjacent to the fundamental. This is evident in both the frequency domain and in the spectrogram. In both displays, the amplitude abruptly drops to -60 dBm. Then at a slightly higher frequency the amplitude rises by about 10 dBm.
In the RF menu bar that appears across the bottom of the screen below the display when RF is pressed, there are some additional controls that influence the spectrogram. The first of these, Spectrogram Traces, brings up a submenu at the right. At the top is a button labeled Normal. It may be turned on or off. The default is on. Turn it off and the trace simply disappears from the display. It can be turned back on, unchanged.
The second button is Average, and the default is Off. Turning it on creates quite an interesting display. The existing trace, which is colored orange, the dedicated RF color, remains in place, rapidly moving as is characteristic of RF electromagnetic energy. With Average turned on, an averaged trace is superimposed. Like other derived waveform images, it is white. When Average is turned on, it can be regulated by rotating Multipurpose Knob a. The values range between 2 and 512. As the number rises, the average trace becomes more constrained.
Working down, the next two buttons are Max Hold and Min Hold, which can be used together or separately. Here again, white is used for the color of traces that show amplitude limits of all displayed frequencies.
Pressing Detection Method, as usual, the submenu appears on the right. This can be set as either Auto, which is default, or Manual, which makes submenu items active. They are Normal Trace Plus Peak, Average Trace Plus Peak, Max Hold Trace Plus Peak and Min Hold Trace Minus Peak. Each of these can be regulated by turning Multipurpose Knob a.
The next spectrogram menu item going across the bottom is Labels. There are many preset labels that can be inserted and displayed, chosen by turning Multipurpose Knob b. Additionally, labels can be customized using the onscreen keyboard. Characters are scrolled using Multipurpose Knob a, and subsequently entered. If you find this process tedious, a standard computer keyboard can be connected to the oscilloscope using a USB cable.
The final Spectrogram menu button is labeled More, and submenu items on the right are Probe Type, voltage or current, and Attenuation, controlled by Multipurpose Knob a. The other Spectrogram Menu item is Compensate Signal Path, which brings up onscreen instructions for performing this operation. It states that the procedure should be performed when the ambient temperature has changed by 10°C. RF signal compensation can be done after the instrument has warmed up, and it requires 30 sec to run. The on-screen window states the date and elapsed time in operating hours since RF signal path compensation last took place.

Leave a Reply
You must be logged in to post a comment.