It pays to know the fundamental parameters that quantify the performance of sound equipment.
By Daniel Knighten, Audio Precision
Quantitative, objective audio measurements have a role to play not just during design validation and as a manufacturing quality control tool, but during all stages of product development . They even come in handy during the earliest stages of development, when a potential product is just a concept.
To understand why, we catalog the most common audio measurements made on complete audio systems and components and what they tell us:
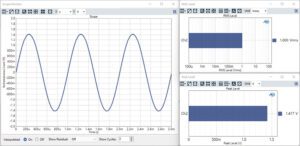
Level, Amplitude – Audio is generally understood to be an alternating signal, ac, in the band between 20 Hz and 20 kHz. When describing the amplitude of an audio signal, the general assumption is that we are discussing the root-mean-square (RMS) amplitude of a signal. That is, in the absence of any other notation, an audio signal described as having a level of 1 V can be assumed to be 1 Vrms. Because of this ambiguity it is helpful when describing the level or amplitude of a signal to note whether it is RMS – Vrms, dc – Vdc, Peak – Vp, or peak-to-peak – Vpp as appropriate.
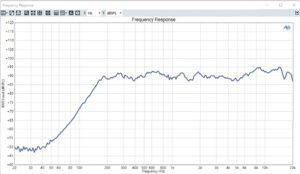
Frequency Response – An ideal audio device linearly reproduces the signals applied to it. There are many ways to make this measurement but the most common is to stimulate the device with a sine wave at one frequency, measure the level of the signal at the output of the device, and then move the test frequency. This is the classic stepped frequency sweep. In the modern era it is still the most common way to make this measurement. But it can also be made with a continuous frequency sweep, a so-called chirp. We can as well make this test with a continuous signal that combines many sine waves at different frequencies simultaneously. This can be a multitone, or it can be calculated using noise, music, or speech signals using a Fourier transform-based transfer function (FFT) calculation.
Regardless of how the measurement takes place, the result is a graph which displays the amplitude response of the test object as a function of frequency. If you had to assess the qualities of an audio device based on a single measurement, that measurement would be frequency response. The frequency response reveals whether a device sounds hollow or boomy, whether speech can be clearly understood, and most importantly is the first order indicator of product quality.
It is also worth noting that most of the additional measurements described here can take place at the same time as the frequency sweep used to yield the frequency response.
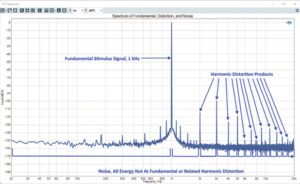
Distortion, THD or THD+N – No audio reproduction device is perfectly linear. The amount of energy in the output of the device, which is not linearly related to the input signal, is called distortion and is most calculated as Total Harmonic Distortion (THD) or Total Harmonic Distortion & Noise (THD+N). For both measurements, the device is stimulated with a pure sine wave at a single frequency. The output signal of the device then has the stimulus signal or fundamental removed with a high-Q, high-attenuation notch filter. The amplitude of remaining harmonic distortion products, THD, or the harmonic distortion products and noise, THD+N, are then measured. Commonly, distortion is expressed as a ratio to the total output signal level in percent or dB (decibels), but it is also sometimes expressed as the absolute amplitude of the component harmonics or total sum of the harmonics and noise.
For speakers, it is common to only report the THD. Most speakers are passive devices and have no sources of noise. A measurement of their THD+N will include unrelated background acoustic noise in the test environment.
For active electronic devices, it is common to report THD+N. All active electronic devices have sources of intrinsic noise. And for some devices, the sources of internal noise may be greater than harmonic distortion.
When measuring distortion, it is critical to be unambiguous about what is being measured. In addition to clarifying whether it is THD or THD+N, it is important to also include the test conditions such as stimulus signal level, output level, and the bandwidth of the harmonic products and noise included in the measurement. Including or excluding harmonics and the bandwidth of the noise can make a radical difference in the measured result. This is one area which often makes it impossible to compare specifications from two different manufacturers. A specification stated as >0.001% distortion leaves too many questions open to be a meaningful gauge of device performance.
Distortion is the simplest audio quality metric beyond frequency response. Given two devices with identical frequency response, most listeners will identify the device with lower distortion as better.
Phase, Delay, Group Delay, and Polarity – Strictly, phase represents the time alignment between two signals typically expressed in degrees of the period of those signals. Phase can be represented as the alignment between two or more output signals, as interchannel phase; or it can be taken from the input of a device to the output; finally, it can be absolute phase.
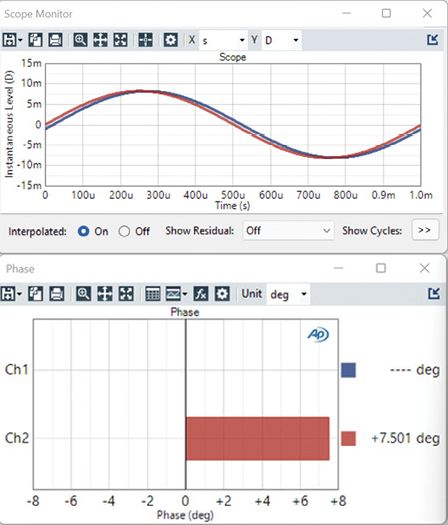
Uncontrolled offsets in phase between output channels can be extremely upsetting to listeners. Humans use differences in phase or delay between our ears to locate objects in space. Listening to a familiar piece of music that has one channel slightly delayed compared to the other can be an amusing way to upset listeners.
A not-uncommon bug in digital signal processing software is to have one channel delayed from the other channel by a single audio sample. A phase measurement will easily detect this.
Absolute phase reveals the transition from capacitance to inductance in electronic components and the movement through the resonant frequency of speakers and microphones.
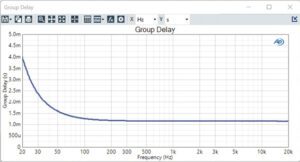
Group delay is the absolute phase of a device expressed as delay in time from input to output. Group delay reveals the effects of high-pass filters, especially ac coupling filters in electronics, and low-pass filters. Group delay is a benchmark measurement in analog-to-digital and digital-to-analog converters.
Noise, Signal to Noise Ratio, and Dynamic Range – All devices that contain active electronics have some degree of intrinsic noise. This intrinsic noise is a floor that sets the lowest level signal devices can reproduce. If you have ever heard white noise or power-line hum from a speaker when no music plays, you understand the issue. There are several different ways to express this noise.
Noise, absolute or intrinsic, is the simplest. With no signal reproduced, any energy at the output of the audio device is captured, and the level of that energy in a defined measurement bandwidth is revealed.
When not playing a signal, some devices will mute themselves or go into a power-saving mode. It is also sometimes desirable to express the self-noise of a device relative to the maximum signal level it can reproduce. Signal-to-noise ratio (SNR) and dynamic range are both ways of expressing this relationship. A classic SNR measurement first measures the maximum output level of a device, then the self-noise. The SNR is then the ratio of the two. In a dynamic range measurement, the process is almost identical except instead of simply turning off the stimulus signal, a signal that is -60 dB to the fundamental is applied and then filtered from the output of the device under test. This ensures that the device does not mute itself when no signal is active.
Crosstalk – If an audio system has multiple channels, the degree of isolation between those channels is a standard measurement. The two-channel stereo system is the classic example of a multichannel audio system. Crosstalk is typically measured by stimulating one channel and measuring how much energy leaks into adjacent channels. High-crosstalk destroys positional information conveyed by multichannel audio systems; it collapses stereo imaging to mono-aural.
Sensitivity & Scaling – This is a significant figure of merit for any device that converts audio signals from one domain to another.
For a/d and d/a onverters, this scaling is the Volts-to-Full-Scale (V/FS) ratio between an analog signal and the digital audio sample values that correspond to it.
For microphones sensitivity is typically expressed as the Volts-output per Pascal of sound pressure (V/Pa).
Speaker sensitivity is usually described as a sound pressure measured at a certain distance for a given power input to the transducer, e.g., 94 dBSPL at 1 m and 1 W. However, in practice a power meter is seldom used. It is assumed that the speaker has a nominal impedance, and a specific voltage is used instead, e.g., 2.83 Vrms is applied to the speaker terminals for a nominally 8-Ω driver.
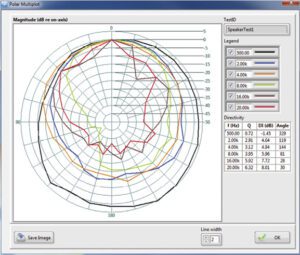
Directivity – When a single frequency response curve is all that is provided for acoustic devices, speakers, and microphones, it is safe to assume that the response curve represents an “on axis” value. That is, the measurement took place with the measurement microphone pointed directly at the device. Few speakers and microphones have a perfect, omni-directional response. In fact, typically it is desirable for a device to project (speakers) or pick-up (microphones) more in some directions over others. Directivity plots are therefore the product of making many frequency response measurements of the speaker and microphone at different orientations. This information is most commonly expressed in a polar plot which renders the response at different frequencies and different angles relative to the test article.
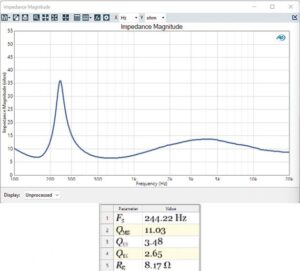
Impedance & Thiele-Small parameters – For loudspeaker drivers and systems, it is important to understand the impedance of the device and specifically the impedance as a function of frequency. It is common to hear speakers described as exhibiting a specific number of Ohms (frequently 8 Ω), but all real-world electro-dynamic speaker drivers have a complex impedance curve.
The impedance curve is important for determining two core requirements. First, what are the amplifier properties needed to successfully drive the speaker? A low-impedance driver will require a higher current supply while a higher-impedance driver will require higher voltage rails. Second, the impedance function is key to deriving the Thiele-Small parameters of the driver. These parameters establish the requirements for the mechanical enclosure that will yield the desired frequency response from the finished system.
Maximum Output, Overload Points – What is the highest signal level a device can reproduce? For some devices the answer is relatively straightforward and perhaps even self-descriptive. If a DAC has a scaling value of 2.5 V/FS, then 2.5 V is the maximum signal it will reproduce. But what about analog amplifiers, speakers, or microphones?
For amplifiers, the traditional definition of the maximum output level is the largest signal amplitude the amplifier can drive into a load of X ohms with less than or equal to a certain distortion. E.G., 12 Vrms into 8 Ω, ≤ 1% THD+N. This figure may be modified by thermal limitations as it is also common to see max output defined in terms of a sine burst waveform. This figure reflects a design that can deliver a certain amount of peak power but only for some number of milliseconds.
For microphones, max level is typically defined as an overload point and often specified in absolute terms, e.g., Overload Point, 120 dBSPL. For microphones, exceeding the overload point may permanently damage the diaphragm, so there are often no other conditions applied to the specification. The one exception is usually just distortion. E.G., 120 dBSPL, ≤ 10% THD.
A variety of factors may go into determining the maximum signal level that a speaker can reproduce. Speakers may be limited by the mechanical travel of the cone, but also by the ability to dissipate heat during extended operation. Consequently, the largest signal a speaker can reproduce is often determined empirically. One technique starts by incrementing the signal level to a speaker and noting the point where higher signal amplitude does not produce a corresponding increase in output level compression. Another approach is to determine the maximum signal a device can reproduce for a given period of time without failure from thermal stress.
Using measurement data
Measurements are the objective expression of subjective product requirements. In the earliest phases of product development, it is useful to have a target frequency and distortion response. Objective quantification of subjective criteria is especially important when undertaking the design of an acoustic device. For speakers it is generally, but not universally, accepted that when measured on-axis in an anechoic environment a flat frequency response is desired. For earphones and headphones, there is no universally accepted, desirable frequency response function. The human ear presents a complex acoustic load that is unique to every individual. For earphones and headphones, it is especially important to create an objective target from the evaluation of subjective criteria.
Beyond the conceptual phase of product development, it is typical to begin qualifying components. At this point, there are two powerful imperatives for audio measurements. While component suppliers generally specify many parameters for parts they supply, those properties may not be paramount for your design. Perhaps more important, almost no two component suppliers specify parameters the same way.
During component qualification, measurements ensure apples-to-apples comparisons among different devices. Measurements also help confirm components meet the specific requirements of your product.
In a nutshell, the chain of audio measurements support objective requirements that ensure a new product performs as intended.


Leave a Reply
You must be logged in to post a comment.