A digital storage oscilloscope (DSO) is characterized by the presence of a microprocessor, which is physically and functionally at the heart of the processing section. Other stages in the processor are the acquisition memory, at its input and the display memory at its output.
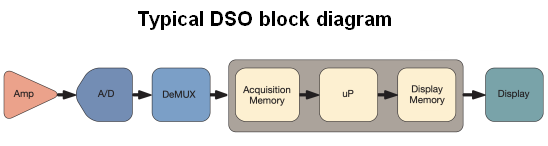 The DSO’s signal paths (one for each channel) begin at the channel inputs, numbered and color-coded ports on the oscilloscope front panel, into which the user can typically insert BNC cable connectors or probes. In a DSO, after digitation, waveforms are stored as binary values. The information remains in the processor, unless intentionally deleted. It can be displayed, analyzed and exported to a flash drive, printer or computer hard drive, where it can be further manipulated or archived.
Immediately following input at one of the channel ports, the signal proceeds to the vertical amplifier. Front panel controls permit the user to adjust amplitude and position relative to the Cartesian co-ordinates, which, rather than by means of a physical graticule, are electronically displayed on the screen. Also, ac coupling or dc coupling may be chosen.
Next, the analog-to-digital converter (ADC) samples the analog signal, creating sample points corresponding to voltage levels at discrete time intervals in the analog signal. In the waveform that is at the input, there are definite voltage thresholds. The digital signal at the ADC output consists of a corresponding series of high and low voltages, which signify logic highs (1) and logic lows (0). The sample points correspond to rising edges of a square wave from a semiconductor clock that is typically external to the ADC. The sample points, stored in the acquisition memory, form waveform points and the record length, which begins and ends with pulses from the trigger system. The digitized signal is manipulated by a microprocessor, which, in response to front panel controls and menu choices made by the user, modifies it. It is then stored in the display memory.
Additionally, the oscilloscope is capable of processing digital signals, which can also be analyzed for the same parameters as analog signals. (In digital troubleshooting, it is often useful to begin by displaying pulse trains as analog signals to determine whether the logic highs and lows are at valid voltage levels, and to look for extraneous noise and distortion.) As digital signals, they are connected to the digital port on the front panel, which is comprised of 16 conductors to accommodate parallel digital systems. Digital signals then bypass the ADC and go directly to the processor.
For analog channels, the ADCs and processor comprise the boundary between the acquisition and display sections of the DSO. Here the complementary procedures of sampling and interpolation are the critical operations that define the DSO.
The oscilloscope user can typically choose any of five types of sampling methods:
The most basic, which is the default sampling method, is simply Sample Mode. It retains the first sampled point in each acquisition interval, discarding all others. It is the most accurate mode for timing interval measurements. Sample Mode uses interleaving of two or more channels to maximize the sample rate.
Peak Detect sampling mode displays all samples between the highest and lowest in two consecutive acquisition intervals. It is useful in displaying high-frequency glitches, but the downside is that it works only in real-time, non-interpolated sampling.
High-Resolution mode calculates the average of all the samples for each acquisition interval. Like Peak Detect, it works only for real-time, non-interpolated sampling. It provides higher resolution but lower bandwidth. Sample, Peak Detect and High Resolution all operate in real time, using the acquired data from a single trigger event. A repetitive signal is not required.
Envelope mode makes use of the highest and lowest record points over all acquisitions. It uses Peak Detect for each acquisition, synthesizing a waveform envelope for the highest and lowest values in successive trigger events. One advantage is that it minimizes aliasing, so that it is useful for repetitive waveforms.
Average Mode calculates the average value for each record point. The user specifies the number of acquisitions that is sampled. An advantage in this sampling mode is that it minimizes noise.
Moving downstream, the digital-to-analog converter (DAC) prepares the signal for display by translating the digital data stream back to an analog waveform.
Interleaving, also known as random interleaved sampling (RIS), produces waveforms at high effective sample rates. The object of that exercise is to attain increased bandwidth. Teledyne LeCroy scope users can choose RIS mode from the time-base settings menu by adjusting it to at or below 20 μsec. RIS uses a device called “time-to-digital converter” (TDC). What is unique is that the trigger point is placed between samples. Then, it discharges with a uniform, lower slope, achieving exceptionally fine resolution. TDC provides values used to bin successive acquisitions. The resultant waveform acquisitions and TDC values enable the instrument to create interleaved acquisitions comprised of single high sample-rate waveforms.
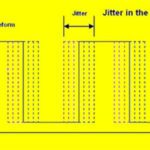
The order in which the waveforms are acquired is not relevant because they are interleaved in a random sequence. Therefore, the waveform must be repetitive, and in each sweep the trigger event must be the same. Non-periodic sequences, such as jitter, invalidate RSI signal integrity measurements in TDR applications.
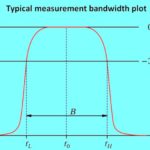
Tektronix users gain bandwidth by means of DSP boosting. This strategy involves selectively amplifying the high-frequency portion of the signal above the bandwidth limit. In DSP boosting, otherwise invisible spectral information is amplified to compensate for high-reactance losses. The device that compensates for attenuation at and beyond the bandwidth limit is known as a DSP arbitrary equalization filter. It is controlled by the user and enables flat frequency response, improved phase linearity, better match between channels, less rise time and improved time-domain response.
Keysight, on the other hand, advocates what it calls “raw hardware performance”. Bandwidth is increased by engineering improvements that eliminate parasitic reactance. Keysight has introduced new preamplifiers and trigger chips along with designs that use them to good effect. The developers are persuaded that interleaving and DSP boosting are not without harmful tradeoffs. They point to equal noise density in the spectral range of 31-32 GHz as compared to 1-2 GHz. These chip innovations are used in Keysight active probes so they do not constitute a weak link in the chain.
Keysight further maintains that interleaving requires more rather than better hardware in the signal path, giving rise to increased noise. The case against DSP boosting is that when the signal is amplified, so is noise within high-performance oscilloscopes, and more noise equates to less accurate measurements and invisible signals below a higher noise floor.
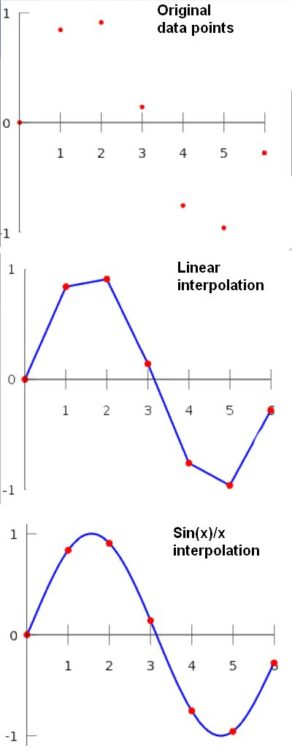 As a general mathematical concept, interpolation is a method of constructing new, otherwise unavailable, data points within the range of a discrete set of data points. There are several methods, each yielding slightly different results. The basic idea is that there are a number of points, based on precise measurements, that are plotted within Cartesian co-ordinates. These dots get connected to create a continuous curve. Between the fixed points, the curve may follow slightly different paths depending on the algorithms used to develop it. This is the essence of digital-to-analog conversion. In an oscilloscope, it takes place instantly and automatically. The user can choose the interpolation method.
In display memory, the principal types are:
Dots only – Interpolation is not performed and only the original sample points are displayed. If the sample rate is high and time/div is long, the sample points will almost merge to form a nearly continuous trace and interpolation may not be needed.
Pulse interpolation draws a horizontal line from the first display point to the time of the next display point. This creates a step pattern, which is the approximate shape of the ideal waveform.
Sin(x)/x uses short sine-wave segments to connect each pair of display points. The amplitude of this curve depends upon a number of factors, primarily the distance between the points. Sin(x)/x is usually the most realistic interpolation method and it is used by default in most digital storage oscilloscopes.
Interpolation can be fully implemented only when sampling is compliant with the Nyquist theorem, which states that the highest frequency component sampled must be less than half the sampling frequency. Samples must also be acquired at equal intervals.


Leave a Reply
You must be logged in to post a comment.