At one time, oscilloscope users estimated waveform metrics by counting divisions and ticks in the graticule, a physical overlay affixed to the display. In the contemporary flat screen oscilloscope, the graticule is an electronic artifact that is part of the display. Its intensity can be varied or turned down to 0% so that it disappears.
The electronic graticule permits the user to instantly get an idea of what is going on, but it is now less important than in the analog epoch. Modern oscilloscopes incorporate a Measure facility that provides reasonably precise measurements of various aspects of the signal of interest, such as peak-to-peak voltage and frequency. We say “reasonably precise” because the accuracy of the measurement is limited by the fidelity of the displayed signal with respect to the actual waveform at the input or probe tip. This is not a problem if you want to know the frequency or rms voltage of a utility power supply as measured at a facility receptacle. But when a weak high-frequency signal as found within RF tuners is the subject of investigation, it may be obscured by noise. As a practical matter, what this means is that the signal amplitude fails to rise above the noise floor of the instrument so it does not appear in the display. This problem can be mitigated provided the nature of the noise is understood.
Electronic noise by definition is a random fluctuation imposed upon any electrical signal. It is generated in all electronic equipment, circuits, devices and conductors, and in any conductive body that is not at absolute 0° K. Electronic noise can be measured as a voltage at the leads of an out-of-circuit resistor or as current if the leads are shunted.
Electronic noise is everywhere. When a signal is to be displayed in an oscilloscope, it must compete with noise that is generated both within the instrument and outside it. If a signal amplitude is less than the noise amplitude, it loses the competition and cannot be displayed. Noise is the enemy of resolution, but there are techniques that the user can employ to influence the outcome, in effect cleaning up the signal.
Electronic noise that results from thermal activity, originating either within or outside an oscilloscope or spectrum analyzer, is what is known as white noise. White noise has an amplitude that is uniform across a large frequency spectrum, falling off only at high frequencies due to parallel capacitance and series inductance.
One technique for reducing noise (lowering the noise floor) is to temporarily limit the bandwidth of the instrument. Because white noise has a significant portion of its power at high frequencies, limiting the bandwidth of the oscilloscope takes that high-frequency portion of the noise out of the acquisition mix so the signal to be measured is no longer obscured by the noise floor. The success of this technique depends on the signal of interest. If its frequency is high enough, it will not be displayed when the bandwidth of the instrument is reduced.
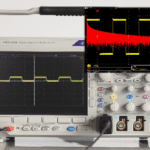
Bandwidth limiting is a rather simple operation. In the Tektronix MDO3104 oscilloscope, press the analog channel input button. In the horizontal menu that appears below the display, press the soft key associated with bandwidth. The choices for this particular instrument are Full (1 GHz), 250 MHz and 20 MHz.
To see how it works, use a BNC cable to connect the built-in function generator to one of the analog channel inputs. Then, press AFG and use the Waveform button to display Sine Wave. Then, press Output Settings. The menu that displays on the right includes Add Noise, so the amount of noise added to the signal can be set anywhere from 0 to 100%, using Multipurpose Knob a. At a certain point, around 15%, triggering is lost as the trace becomes increasingly impacted by the added noise.
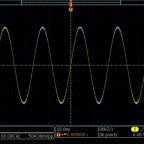
Now, go back to Bandwidth. Limiting it to 250 MHz may not have much effect, but limiting it to 20 MHz should make the signal stand out above the white noise floor. Also, in Waveform Settings, the frequency of the original sine wave can be adjusted, and you can see how this change influences the effectiveness of bandwidth limiting.
When bandwidth limiting is not viable due to the high frequency, there is another stratagem that works well and that doesn’t depend on the frequency spectrum of either signal or noise. It is known as signal averaging. It works only with a repetitive signal.
The basic idea is simple. As in bandwidth limiting, the signal is strengthened relative to the noise floor. There is not, however, a problem with a high-frequency signal. A specified number of waveform cycles are averaged to make a single display. Because the signal is repetitive, the successive traces are identical and the product of the averaging process is an accurate rendition of the signal at the oscilloscope input.
The situation with regard to the accompanying noise is quite different. Because thermal white noise is random, the averaging operation causes noise information that appears in successive cycles to cancel out, essentially disappearing so the signal display is not compromised.


Here again, the actual operation in the Tektronix MDO Series 3000 oscilloscope is beyond simple. With the signal of interest displayed in the instrument, press the Acquire button. The horizontal acquisition menu appears below the display. Press the soft key associated with Mode. Then, press the soft key adjacent to Average in the submenu that appears to the right of the display. Multipurpose Knob a regulates the number of waveforms that are to be averaged, ranging from 2 to 512. This results in better resolution.
As more waveforms are averaged, vertical resolution improves. The number of bits of vertical resolution increases by one as the number of waveforms that are averaged increases by four. However, there will be a ceiling of about 12 bits of vertical resolution that enters the picture because of certain constraints including vertical gain and offset accuracy.
Moreover, the hard fact is that boosting the number of waveforms that are averaged impacts oscilloscope operation: The waveform update rate drops because there’s a greater burden on the instrument CPU, which is tasked with performing the computations. Whatever problems that go along with waveform averaging, its overwhelming advantage is that it doesn’t place a limit on the instrument’s effective bandwidth, originally acquired at great cost.
There is another altogether different type of waveform averaging, known as high-resolution mode. The difference is that it does not require a repetitive waveform. This mode, which is not available in all instruments, can provide as much as 12 bits of vertical resolution in real time. Unlike the normal mode which averages successive waveforms, high-resolution mode averages sequential points within a single acquisition. As in the normal mode, this averaging reduces noise and boosts vertical resolution.
Another difference between the two modes is that in the high-resolution mode, the user has no direct control over the number of averages. The oscilloscope’s time/division setting takes over this function. However, the user has the ability to alter the oscilloscope’s memory depth and in that way indirectly control the number of points that are averaged.
In the Tektronix Series 3000 oscilloscope, the procedure for using the high-resolution mode is simple. Assuming that a signal is displayed, and it is seen to be obscured by noise, press the Acquire button. The Acquisition Menu appears below the display. Press Mode, and in the Acquisition Mode submenu that appears to the right of the display, press Hi Res. Notice now that the user can no longer adjust the number of averages.
To summarize, noise in a signal that is displayed on an oscilloscope can be significantly reduced by either bandwidth limiting or waveform averaging. Both methods work well, but bandwidth limiting can impact the signal if its frequency puts it out of range. When this happens, waveform averaging is the way to go. It may be necessary to adjust memory depth to obtain the optimum display.

Leave a Reply
You must be logged in to post a comment.