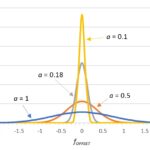
Phase noise is an artifact of a nonideal oscillator and is best investigated in the frequency domain. Phase noise accompanies the generation of any real-world sinusoidal signal. You can think of it as the analog equivalent of digital jitter, which we covered in an earlier series (read part 1 and part 2). Recall that jitter […]
FAQ
How to test the automotive SENT protocol
Oscilloscopes and dedicated software can help analyze SENT data. In “What is the automotive SENT protocol?” we looked at the Single Edge Nibble Transmission (SENT) protocol, as defined in accordance with the Society of Automotive Engineers (SAE) J2716 standard. We reviewed the SENT message frame, which includes a synchronization/calibration pulse followed by a status nibble, […]
What’s the difference between a USB oscilloscope, spectrum analyzer, and digitizer?
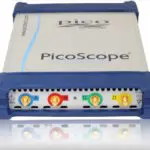
USB oscilloscopes are highly versatile instruments. With the right software, they can perform functions usually reserved for spectrum analyzers and digitizers. In some cases, however, special instruments are needed for optimal results. This FAQ compares the functions of oscilloscopes, spectrum analyzers, and digitizers with USB interfaces. They are called USB devices because they connect to […]
How to use simple antennas for EMI troubleshooting
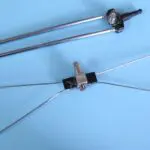
For general troubleshooting, you can use consumer-grade antennas such as for TV. Pre-compliance tests require calibrated antennas. Antennas are important for capturing radiated harmonic emissions from electronic products. You can use them for simple troubleshooting or for calibrated pre-compliance testing. For troubleshooting purposes, you can use almost any uncalibrated antenna. I’ve even seen engineers use […]
How do I choose an electric motor, and how do I test it? part 4
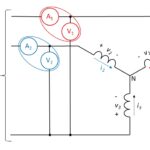
You indeed can measure three-phase power in a motor with just two wattmeters. Part 3 of this FAQ concluded with a simplified diagram showing a test setup that included a programmable power supply, a motor under test, a mechanical load, a power analyzer, and host computer. The programmable power supply could simulate the AC line […]
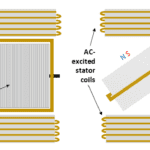
How do I choose an electric motor, and how do I test it? part 3
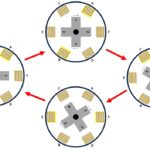
Motors follow the path of less reluctance to rotate. Thus, you need timing of applied power to get them moving. Part 1 and Part 2 of this FAQ looked at brushed and brushless DC motors, permanent-magnet and wound-rotor synchronous motors, and induction motors. These motors all have drawbacks, including mechanical wear of commutators, slip rings […]
How to use RF current probes for EMI: Part 2
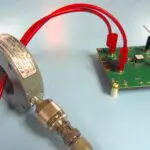
In Part 2, you will learn how to use an RF current probe to calculate E-fields and troubleshoot EMI emissions from cables. Free and low-cost software tools let you customize the calculations based on your current probe’s data. As I mentioned in Part 1, RF current probes are one of my most useful troubleshooting tools. […]
How to use RF current probes for EMI: Part 1
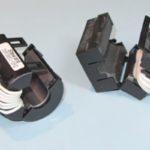
DIY and commercial RF current probes let you find which cables act as EMI-emitting antennas. RF current probes are one of my most useful troubleshooting tools. Because most radiated emissions failures are due to attached cables acting as transmitting antennas, clamping an RF current probe around a wire or cable will measure the common mode […]
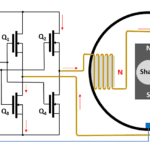
How do I choose an electric motor, and how do I test it? part 2
Learn the basics of back EMF, how to measure it, and the advantages and disadvantages of different motor types. In Part 1 of this FAQ, we looked at brushed DC and brushless DC (BLDC) motors, with the latter having some similarities to a permanent-magnet synchronous motor (PMSM). The simplified PMSM diagram in Figure 1 resembles […]
How to choose and test an electric motor: part 1
Motors bridge electronics with electromechanical devices. To learn how to test motors and their electronics, you should first understand how motors work. Electric motors are ubiquitous, appearing in everything from electric toothbrushes to electric locomotives. There are, however, seemingly almost as many motor types and configurations as there are applications, which makes choosing and testing […]
