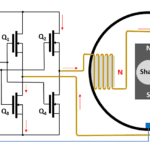
Motors bridge electronics with electromechanical devices. To learn how to test motors and their electronics, you should first understand how motors work. Electric motors are ubiquitous, appearing in everything from electric toothbrushes to electric locomotives. There are, however, seemingly almost as many motor types and configurations as there are applications, which makes choosing and testing […]
FAQ
What’s the difference between a PCIe analyzer and jammer?
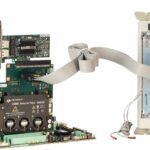
Protocol analyzers and jammers let you test and troubleshoot the performance of PCIe interconnects. From generation to generation, PCIe speeds double. Today’s protocols can be challenging to test and qualify. In addition, advanced applications such as the non-volatile memory express (NVMe) solid-state drive (SSD) memory protocol developed specifically for use with PCIe require sophisticated testing […]
How to locate EMI emissions with near-field probes: Part 3
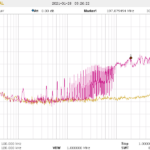
Part 3 of a series on using near-field probes for detecting EMI sources shows you how to set up a spectrum analyzer and how to detect emissions problems. Now that we’ve discussed the theory of measuring near-field emissions (Part 1) and how to use near-field probes (Part 2) to make the measurements let’s discuss how to […]
How to locate EMI emissions with near-field probes: Part 2
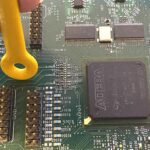
Now that you know a little theory of near-field measurements, how do you use near-field probes and a spectrum analyzer to help you troubleshoot and mitigate emissions issues? Remember, as mentioned in Part 1, that deciding whether to use an H-field or E-field probe depends on whether you’ll be probing high switching currents — di/dt […]
How to locate EMI emissions with near-field probes: Part 1
Near-field probes let you find the sources of near-field and far-field EMI that ruin your design, and your day. You don’t need to know Maxwell’s Equations to troubleshoot your designs.
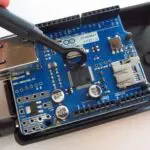
What hardware accessories can you attach to a USB oscilloscope?
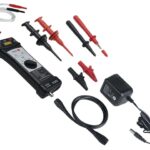
A wide range of hardware accessories are available for USB oscilloscopes. This FAQ reviews a few of the more popular options including a variety of probes plus wireless synchronization of multiple USB oscilloscopes and chassis that can combine and synchronize USB oscilloscopes with other instruments like arbitrary waveform generators and multimeters. Probes and more probes […]
What are the important specifications of USB oscilloscopes: Part 2?

USB oscilloscopes can be highly useful design, development, and testing tools. Like many tools, they need to be optimized for specific use cases. This second FAQ looks at specifications for triggering, input ranges and probes, zooming, and control software. Part 1 considered specifications for the number and types of channels, bandwidth, sample rate, refresh rate, […]
What are the important specifications of USB oscilloscopes? part 1
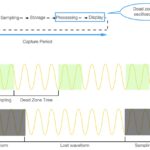
USB oscilloscopes are compact and low-cost. If properly specified, they can be highly capable instruments. This FAQ reviews some important USB oscilloscope specifications including the number of channels, sample rate, bandwidth, refresh rate, and memory depth. Part 2 of this series considers specifications (available Sept. 8) for triggering, input ranges and probes, zooming, and control […]
What specialist software is available for USB oscilloscopes? part 2
This FAQ looks at software that can synchronize multiple oscilloscopes, perform mathematical functions, and transform a basic USB oscilloscope into multiple instruments. A USB oscilloscope consists of signal capture and conditioning electronics, a personal computer (PC) that can be a laptop, tablet, or desktop, plus PC software. The availability of application specialist software is a […]
What specialist software is available for USB oscilloscopes? part 1
USB oscilloscopes capture analog and digital signals. Through software, engineers can analyze protocols and logic signals. By adding a D/A converter, a USB oscilloscope can also become a waveform generator. A USB oscilloscope consists of the signal capture and conditioning electronics package, a personal computer (PC) that can be a laptop or tablet unit, or […]
