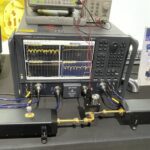
Test equipment plays a major role in product development and production, which was apparent at IMS 2023. In the photos and videos below, you’ll get a taste of test developments at RF, mmWave, and sub-THz frequencies. This year, D-band (110 GHz to 170 GHz) seized a larger portion of the exhibit hall than in past […]
vector network analyzers
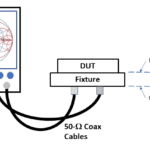
What is de-embedding and how do I perform it (part 1)?
It’s a tenet of the test-and-measurement industry that you should concentrate on looking for defects in your device under test (DUT) — not in your test equipment. Figure 1 illustrates a common problem. An instrument presents an incorrect reading; in this case, an LRC meter or multimeter presents a resistance reading that’s about 5% low. […]
What are insertion loss and return loss and how can I measure them?
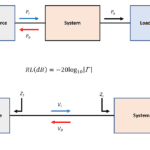
These basic RF measurements often uncover system problems in wired and wireless communications. If you observe a signal traveling from a source to a load through a passive system of some sort, you will notice that the signal attenuates by the time it reaches the load, and you will also notice that some of the […]
The difference between impedance analyzers and network analyzers
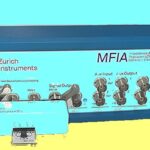
At first glance, impedance analyzers and network analyzers seem to do the same thing: Describe the impedance of whatever is connected to their inputs. This statement is true as far as it goes, but as you might expect, there are significant differences between the two types of instruments. Here’s a review of the basics. There […]
IMS 2022 video: Test equipment
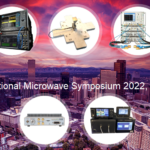
Several test equipment companies demonstrated their latest products for attendees of the International Microwave Symposium.
The difference between VSWR and the S11 reflection coefficient
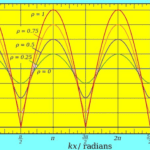
A traveling signal along an electrical transmission line reflects back toward the source when one or more events occurs: One or both of the conductors is open at the far end (receiving end). The conductors are shorted at the far end (very common). There is a discontinuity in the characteristic impedance or an electrical fault […]
PC-based VNAs get automated E-Cal, TRL/TRM calibration
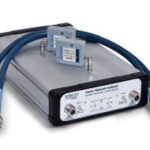
The PicoVNA 108 8.5 GHz analyzer now includes automated E-Cal calibration and TRL/TRM calibration. The PicoVNA 108 achieves calibration automation through either male SMA or female SMA E-Cal modules. These are USB-powered and controlled to electronically select the various short, open, load and through reference standards as they are needed within the calibration process. You […]
VNAs cover 9 kHz to 8.5 GHz with 1-Hz resolution

The Siglent SNA5000A series of two- and four-port vector network analyzers offer a frequency analysis range of 9 kHz up to 8.5 GHz with a resolution of 1 Hz, a dynamic range of 125 dB, and a level resolution of 0.05 dB. The Siglent SNA5000A series consists of four models (4.5 GHz or 8.5 GHz […]
