Jitter and frequency modulation both involve a change in the frequency of an underlying signal. It’s worth investigating how the two phenomenon differ.
Jitter is usually defined as an undesired deviation in timing of a signal from its original periodicity. It can take the form of variations in phase, period, or duty cycle. And jitter is often, but not always, a problem in digital waveforms where it is quantified as a deviation from some reference clock signal.
Wander refers to the same phenomenon at any frequency below 10 Hz. Wander and jitter are precisely identical except for an arbitrary frequency level that distinguishes one from the other.
Interestingly, there are currently no industry standard ways of measuring jitter. JEDEC standards do provide guidance and suggested test conditions, but they can be implemented in different ways in different instruments.
Random (Gaussian) jitter is caused by thermal noise, which is a property of any conductor that is not at absolute zero degrees Kelvin. In contrast, deterministic jitter is bounded and predictable, and conforms to non-normal distribution. It may or may not be correlated to the data stream. Examples of data-dependent jitter are duty-cycle dependent jitter and intersymbol interference.
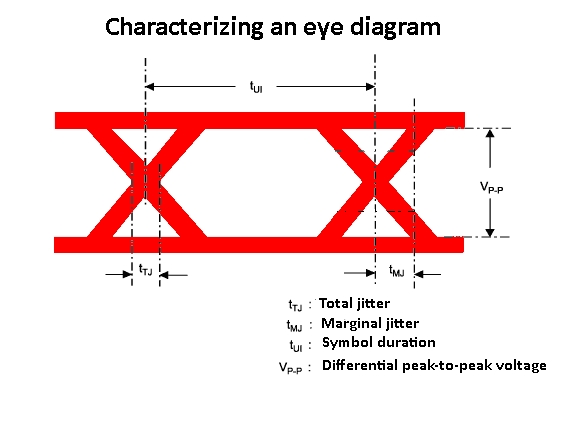 An important tool in testing for jitter is the eye diagram, which has a distinctive appearance. As displayed in an oscilloscope, the eye diagram looks like a pair of human eyes situated between two horizontal lines, an upper rail and a lower rail. The pattern is generated when a digital signal is continuously sampled and applied to an oscilloscope’s vertical input. Simultaneously, the horizontal sweep is triggered at the data rate.
The eye diagram can be analyzed to evaluate channel noise and intersymbol interference as they combine and impact baseband pulse propagation. As time elapses, the signal continuously retraces in the oscilloscope display, and progressive excursions from the rails cause the eye to irreversibly close, a sign of signal waveform distortion. An open eye, in contrast, shows that signal distortion is less destructive. Specifically, peak-to-peak, random, deterministic and total jitter can be detected and evaluated. Eye width indicates timing synchronization and jitter, while eye closure indicates intersymbol interference and additive noise.
Jitter measurements in the time domain (specifically period and cycle-to-cycle measurements) are random and typically expressed as a mean value and standard deviation over a number of samples. JEDEC standard 65 requires a minimum of 1,000 samples, but a 10,000 sample minimum is preferred by most applications.
Period jitter is the difference between a measured clock period and the ideal period. In reality, it may be difficult to quantify what the ideal period is. Modern oscilloscopes typically read out an average measured clock period for a signal on their input. For example, a scope might measure an average clock period for a 125-MHz signal as 7.996 nsec instead of 8 nsec. So it is common practice to treat the average observed period as the ideal period. The standard procedure for measuring period jitter is to randomly measure the duration of one period 10,000 times, then use the resulting data to calculate the mean, standard deviation and peak-to-peak values. Because period jitter is random, the peak-to-peak values can vary greatly, so it is common practice to re-calculate jitter several times to produce an average value.
Measurement of cycle-to-cycle jitter involves randomly measuring the duration of two clock periods 10,000 times, then taking the absolute difference between the two. The recorded data is used to calculate the mean and standard deviation values. The peak value is simply the largest difference in observed periods observed. Often times cycle-to-cycle jitter must be re-calculated repeatedly to produce an average value. Some digital scopes have a histogram feature which simplifies the math.
Similarly, time interval error (TIE) jitter or phase jitter usually involves plotting a histogram of measurement values versus the frequency of occurrence of the measurements.
Frequency domain measurements of jitter primarily take place on signal source analyzers (SSA). These instruments are often characterized as modern versions of swept-spectrum analyzers where the input RF signal is down-converted to a lower intermediate frequency (IF). A digitizer converts the analog IF signal into a digital signal that is then analyzed via the FFT. The signal analyzer can also fix its local-oscillator frequency and perform a time-signal-capture and spectrum analysis at that fixed center frequency. SSAs typically have a low noise floor (-180 dBc/Hz), and incorporate cross-correlation techniques that further reduce the test system noise.
Jitter can be viewed as a deviation of signal frequency caused by noise. In frequency modulation, the signal frequency is deviated as a means of encoding information on the signal, usually called a carrier wave. Specifically, FM is the encoding of information in a carrier wave by varying the wave’s instantaneous frequency. In analog FM, as with FM radio broadcasting, the instantaneous difference between the frequency of the carrier and its center frequency is proportional to the modulating signal.
FM isn’t just for analog information. Digital data can also be encoded and transmitted via FM by shifting the carrier frequency among a predefined set of frequencies representing digits where, say, one frequency represents a binary one and a second represents binary zero. This modulation technique is called frequency-shift keying (FSK).
An important concept in FM transmission is modulation index, b, expressed as
b = Df/fm
where fm is the maximum modulating frequency, and Df is the peak frequency duration.
The bandwidth B of an FM signal is expressed as B = 2(b+1)fm.
Frequency modulation is classified as narrow-band if the change in the carrier frequency is about the same as the signal frequency, wide-band if the change in the carrier frequency is much higher (modulation index > 1) than the signal frequency. Narrow-band FM is common in two-way radio systems. Wide-band FM is used for FM broadcasting, where music and speech get transmitted with up to 75 kHz deviation from the center frequency.

One way of measuring frequency deviation of an FMed carrier is with a spectrum analyzer. First center the carrier frequency on the display, then set the resolution bandwidth to encompass the amount of frequency deviation. Then turn on the analyzer’s min hold and max hold functions, functions that are widely available on modern analyzers. Within a short time, the result will be an envelope of the frequency deviation of the carrier. Now markers on the display (also available on modern analyzers) can be moved to denote the distance between the min hold and max-hold lines along a common power level. The delta frequency between these two points represents the peak-to-peak deviation of frequency at that power level. Half that amount is the peak deviation.

Leave a Reply
You must be logged in to post a comment.