When you hook a signal up to an oscilloscope or spectrum analyzer, you have usually done so because you are looking at a signal that is changing over time. Two properties of changing signals are bandwidth and dynamic range, and these metrics are also specifications in the instrumentation that is used to display the signals.
Bandwidth has numerous definitions, depending on the context. In signal processing, it is a measure of the width of the range of frequencies, measured in Hertz. Dynamic range is the ratio of the largest and smallest values of a changeable quantity. What bandwidth is for frequency, dynamic range is for amplitude.
Dynamic range in human perception is large, best shown on a decibel scale where the rate-of-change is represented on a dramatically reduced scale as the intensity rises. Typical dynamic ranges are 90 dB for human vision and 100 dB or more for human hearing. It must be noted, however, that the high and low levels cannot be perceived simultaneously. Distant stars are not visible in daylight.
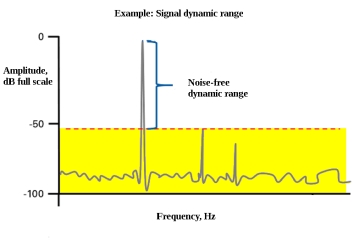
In an oscilloscope or spectrum analyzer, dynamic range is the ratio between the highest and the lowest-power signal simultaneously present at the input, where both of these signals appear in the display. These signals may or may not be harmonically related. This definition takes into account the fact that noise floor, resolution bandwidth and linearity all compromise the visibility of the low-level signal. The high-level signal must be present and free of clipping if valid measurements are to be made.
Generally, there is a significant trade-off between bandwidth and dynamic range. Dollar-for-dollar, the oscilloscope will have more bandwidth and the spectrum analyzer will have more dynamic range. A typical high-end spectrum analyzer has a 165 MHz bandwidth while a 2-GHz oscilloscope’s bandwidth is greater by a factor of over 20. Where a spectrum analyzer exceeds a similarly ranked oscilloscope is in its enormous dynamic range.
The maximum amount of power that can be fed into the input without physically damaging the spectrum analyzer sets the upper limit of its dynamic range. This figure is usually printed on the equipment cabinet and also stated prominently in the user manual. For most spectrum analyzers, it is one watt. The lower limit of the dynamic range is the noise floor of the instrument, because lower level signals cannot be discerned.
If there is a problem in measuring small signals, the large signals can be moved above the upper limit of the display. They can be moved as much as 10 dB by altering the reference level. For a spectrum analyzer to deal effectively with small signals, the noise floor should be made as low as possible.

All electrical components, including conductors such as BNC cables, are sources of noise, and noise is a thermal phenomenon. There is a certain amount of heat generated within the spectrum analyzer enclosure. It is caused by the power supply, semiconductors, flat screen display, etc. These sources add to ambient heat from outside. Additionally, there is noise that accompanies the signal prior to the instrument input. Because noise is a broadband phenomenon, it is possible to reduce it by limiting the bandwidth. That is where the reduced bandwidth of the spectrum analyzer is a plus.
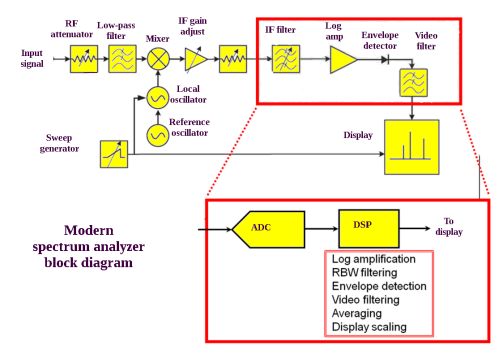
In the discussion that follows, it is important to realize that unlike an oscilloscope, the spectrum analyzer incorporates superheterodyne technology as found in virtually all radio receivers. As such, it has a local oscillator, mixer, intermediate frequency circuitry and a detector. These stages may play a role in signal distortion if measures are not in place to mitigate these effects, which otherwise could impair dynamic range.
 In a spectrum analyzer, dynamic range determines whether or not low-level signals can be discerned when high-level signals are simultaneously present. Factors that determine dynamic range include display range, measurement range, noise floor, phase noise and spurious response of the spectrum analyzer.
In considering spectrum analyzer measurement range, it is worth emphasizing that dynamic range, the difference between smallest and largest signals that can be discerned, must allow for different instrument settings. As mentioned previously, for most spectrum analyzers, the high limit is one watt. The noise floor sets the low limit. It may not be possible to access the low limit with the same input attenuator level that is used to see the one-watt level.
The calibrated amplitude of the display may further limit the display. The ideal display, calculated by counting divisions, may be limited by the log amplifier.
The mixer compression level may also degrade the accuracy of the displayed signal. As long as the signal level at the mixer is definitely below the compression point, there is no problem in this regard. However, a higher level may cause distortion, whereupon a definite amount of energy is lost. In instruments where it is possible to adjust the maximum mixer level, this adjustment can limit distortion in high-level signals.
Internal distortion becomes important when measuring products of distortion including but not limited to harmonic distortion from a discrete signal or inter-modulation distortion from several signals. If the signal at the mixer is sufficiently low, internally-generated distortion will not enter the picture. However, noise may then compromise the signal, so it is a question of finding the best level.
 In considering spectrum analyzer dynamic range, two types of noise factor in, phase noise and sensitivity. Because noise is a broadband phenomenon, boosting bandwidth in a spectrum analyzer lets more noise hit the detector. This results in a higher amount of phase noise and a higher noise floor. Consequently, bandwidth adjustment is sometimes appropriate. This can be accomplished either internally or, if the source of noise is external, by means of a filter that you put together.
The reason the sensitivity of a spectrum analyzer is important is that it constitutes the absolute theoretical lowest level of the noise floor. This level is also called the Displayed Average Noise Level (DANL). It is 174 dBm for a noise bandwidth of one Hertz at room temperature. Remember that inside the spectrum analyzer it is much warmer. It might be possible to change this situation by introducing external cooling, such as locating the instrument near an air conditioner.
Phase noise (also called sideband noise) becomes significant when measuring two signals that are close in frequency. It is caused by instability of the local oscillator. It is the nature of an oscillator that it will be phase-modulated by unintended noise. Any such instability will show up in the displayed signal through the mixer. This appears most prominently when the signals to be measured are close in frequency, i.e. less than one megahertz apart.
Distortion performance of the input mixer, sensitivity (DANL) and phase noise due to the local oscillator all work together to limit second- or third-order dynamic range. These factors can be mitigated on a case-by-case basis to optimize the measurement of the signal(s) under investigation. To do this, power at the mixer can be adjusted to equalize sensitivity and internally generated distortion.
Spectrum analyzer measurements are not for the faint-hearted. They are an order of magnitude more challenging than similar oscilloscope undertakings. The best way to get a handle on spectrum analysis is to connect the analyzer to the output of an oscilloscope having an internal arbitrary function generator whose waveforms can be altered in terms of amplitude, frequency and duty cycle. (A USB device can be used to store and transport these signals to another instrument.) Then, switching cables as needed or using a USB hub, view the signals both in the time domain on the oscilloscope and in the frequency domain on the spectrum analyzer to see what patterns emerge.
A good exercise is to adjust the amplitude of the source signal and see how this plays out in relation to the spectrum analyzer’s noise floor. Also, if noise can be added to the source signal, see how it can be mitigated in the spectrum analyzer (and in the oscilloscope) by limiting the bandwidth.

Leave a Reply
You must be logged in to post a comment.