The difference between a mixed-domain oscilloscope (MDO) and a mixed-signal oscilloscope (MSO) is that the MDO simultaneously displays the same signal as time-synchronized time-domain and frequency- domain traces, while a mixed-signal oscilloscope displays similar view of two different signals, typically from the same piece of equipment. For example, an MSO lets the user examine time-coordinated views of the digital output and the power supply, to see if an anomaly in the power supply coincides with an anomaly in the digital output. If so, you’ve found the problem, which may be a design defect or an acquired electrical fault.
Just about any modern oscilloscope has the ability to calculate and display an acquired time-domain signal in the frequency domain. It performs this function by making use of Fast Fourier Transform (FFT) algorithms that are built into the machine. By pressing a button, the instrument instantly transitions between time-domain and frequency-domain displays of the signal that is at an analog input. Identical information is present in the two modes, and no information is lost in going from one to the other. It is the same waveform, just graphed differently, i.e. with X- and Y-axes variously defined.
Such capabilities are far surpassed in an MDO instrument, which employs a different internal architecture to process the signal in a more advanced way.
It took three separate instruments in the pre-MDO world to make meaningful analog, digital and RF measurements. The oscilloscope created a real-time display in the time mode of the signal connected to an analog input. A logic analyzer was needed to make a real-time display of digital signals, likewise in the time domain. An MSO performs both these measurements. The third autonomous instrument needed was the spectrum analyzer. Traditionally, this was a stand-alone, bench-type instrument whose primary function was to make measurements on RF signals in the frequency domain.
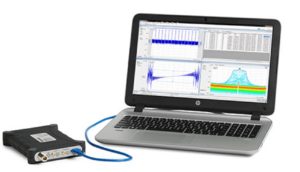
One of the latest instruments from Tektronix is a PC-based spectrum analyzer module that makes use of a laptop or desktop computer and monitor to provide a wide range of features in frequency domain display and measurement.
Spectrum analyzers appeared on the test and measurement scene around 1960. At first they were what is known as swept-tuned instruments, soon evolving into real-time machines. The swept-tuned spectrum analyzer incorporates the old superheterodyne principle to down-convert a part of the spectrum to a range defined by a band-pass filter. A voltage-controlled oscillator performs this function by beating with the full spectrum at the input. The resolution bandwidth, as determined by the bandwidth filter, is a key metric of the swept-tuned spectrum analyzer, and as usual in such matters, there is a trade-off between update speed of the now-constrained frequency and the frequency resolution, which in turn dictates the ability of the user to distinguish adjacent frequency signals.
In contrast, a real-time spectrum analyzer samples the frequency spectrum in the time domain. Subsequently, the data is reformatted in the frequency domain by means of FFT algorithms. Multiple FFTs provide a seamless RF spectrum display. For this purpose, the Nyquist Sampling Theorem must be observed to prevent aliasing. Then, data is stored in the instrument’s memory so that it can be recalled, processed and displayed, limited only by the capacity of the memory and bandwidth of the spectrum analyzer.
The MDO instrument integrates these three instruments in a single enclosure. Unlike an oscilloscope with mere FFT functions, the MDO has separate and independent acquisition systems to optimize the time and frequency domains. This enables enhanced frequency domain measurements and spectrum analytics. Because there are separate acquisition systems, the MDO can optimize views in the frequency and time domains though they are displayed together.
An MDO’s display includes labeling of amplitude grid lines, start and stop frequencies, peak markers and frequency domain metrics, including vertical scale, center frequency, reference level, span and, most important, resolution bandwidth.
Unlike an oscilloscope that has add-on FFT capability, a true MDO incorporates many measurement enhancements previously found only in advanced spectrum analyzers. For example, automatic markers are a part of the MDO so that upwards of a dozen highest-amplitude frequencies can be tracked continuously. Additionally, an MDO can display channel power, adjacent power ratio and occupied bandwidth measurements. These numbers appear in the display at the relevant portion of the trace, such as at the peak associated with a fundamental.
A spectrogram function, shown in split-screen format above the basic frequency domain display, provides information about RF signals whose frequencies are subject to change.

To understand how an MDO realizes its superlative RF performance, we’ll consider the signal flow from RF input to the flat-screen display. To begin, for perspective, we’ll consider the traditional swept-tuned spectrum analyzer.
At the input, after passing through an attenuator and low-pass filter, the signal is conveyed to an RF down converter where, in the fashion of a superheterodyne radio receiver, its frequency is substantially reduced. This is made possible by an internal sweep generator and a swept-tuned local oscillator. (The sweep generator output also feeds to the display, where it is fed to the X-axis to arrange the amplitude information according to frequency.) A detector performs the function of ascertaining the signal’s amplitude on a point-by-point basis throughout the span. Because the frequency points must be calculated individually, the system despite its high dynamic range is capable of analyzing only signals that are stable, narrowband and unchanging.

The vector signal analyzer (VSA) has a quite different, newer and more advanced architecture. It is also a superheterodyne machine, but the local oscillator is stepped, rather than swept. The filtered and digitized signal is now converted from the time domain to the frequency domain by means of a Discrete Fourier Transform (DFT).
The product, a small segment of the spectrum, is then drawn. Because the local oscillator’s frequency changes in carefully measured steps, a composite display results. The instrument is capable of displaying a temporally varying signal, provided the frequency is within the relatively narrow step width, typically less that 25 MHz.

As in other electronic equipment, a design mandate is to improve the signal-to-noise ratio. There is always electronic noise, which is a consequence of random electron motion that is not part of the signal. This motion arises in any device or conductor regardless of whether it is energized from outside. Noise is thermally dependent and generally it is very broadband.
An oscilloscope is essentially a sensitive auto-ranging voltmeter. It is like a radio or a TV with automatic gain control (AGC). In the absence of a strong signal, we hear noise in the audio and see snow in the video. These effects disappear when a good signal is tuned in because the AGC reduces the amplification.
In the absence of a signal in an oscilloscope, especially in the frequency domain, this noise is shown as an irregular trace, known as the noise floor. A signal that is sufficiently weak will be lost in the noise floor and cannot be displayed. In oscilloscope design and use, efforts are made to lower the noise floor and/or reduce the noise at the input so as to improve the signal-to-noise ratio.
There are some measures that the user can employ to improve the situation. Because noise is mostly a broadband phenomenon, it can frequently be mitigated by temporarily limiting the bandwidth. Of course, this strategy cannot be used when the signal under investigation requires a high bandwidth display. To illustrate, in a Tektronix MDO 3000 series oscilloscope, first connect the internal AFG output to the channel one analog input. Press AFG to display the sine wave, which is the default selection.
Then, in the AFG menu, press Output Settings. The second item in the menu to the right of the display is Add Noise. Using Multipurpose Knob a, increase the noise component to 20 percent. The trace thickens perceptibly and triggering is lost.

Pressing the Channel One button, a menu appears under the display. The bandwidth can temporarily be limited to 250 MHz or 20 MHz. Cutting the bandwidth to 250 MHz has little effect. But when it is reduced to 20 MHz, triggering is restored and most of the noise is eliminated from the trace.

If the oscilloscope is powered down and turned back on, the bandwidth remains at the low level, so this is one good reason to press Default Setup before starting a new project.
Another way to reduce noise is by means of waveform averaging, which has the effect of canceling the random effect of noise so as to improve the signal to noise ratio. These noise reduction methods, undertaken by the user, are effective when combined with MDO design innovations that have substantially lowered the noise floor, making it possible to display very weak signals.

Leave a Reply
You must be logged in to post a comment.