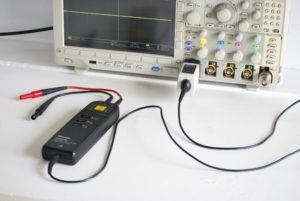
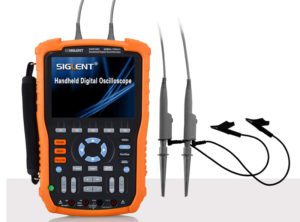
The word oscilloscope is mostly used to refer to a bench-type instrument, but scopes also exist as hand-held, battery-powered versions. The bench-type oscilloscope, model-for-model, usually has more features, higher specifications such as bandwidth and sampling rate, more controls, deeper menus and so on.
The hand-held, battery-powered oscilloscope, in contrast, is smaller and more portable, well-sealed and protected, therefore less prone to damage from dropping, and better suited to a factory environment. It only needs an ac power supply for recharging the internal battery.
One of the greatest advantages of a portable oscilloscope is its fully-isolated analog inputs. In contrast, the inputs on bench models are referenced to the premises grounded conductor, color-coded white in the U.S. For this reason, a reversal of the probe tip and ground-return lead connections may lead to an intense short circuit with a shower of sparks, smoke and heat.
The hand-held, battery-powered oscilloscope, with inputs isolated from ground and (usually) from each other, avoids this hazard. The inputs can safely be connected to the circuit under investigation without regard to polarity as long as voltage and current levels are observed.

One widely used portable scope is the Siglent SHS 1102. This is a well-built and reasonably priced instrument at home on the factory floor and even outdoors where it would be impractical to operate a bench model.

The Reference menu items are Source > Channel One, Reference A, Save and Reference B, which can be toggled off but cannot be toggled back on except by once more pressing Scope and Reference.
The Reference waveform menu has two signal choices, Channel One and Channel Two, by means of which the waveform to be saved is chosen. Activating F4, the Save function, will save the waveform in either Channel One or Channel Two (depending on which is activated). To display the Reference waveform, we press F5. This key can also be used to toggle on and off Reference A or B.
If there is a question as to whether a reference or real-time signal is being displayed, the probes can be disconnected from the oscilloscope or from the work to settle the matter. When the power button is cycled, it will be seen that the reference waveform remains in non-volatile memory.
For this exercise, we are connecting the Channel One and Channel Two probes to utility power, in this instance reversing the probe tips and return leads polarities so as to display two sine waves, one the inverse of the other. This type of hookup, for reasons outlined above, could not be made with conventional bench oscilloscopes.
Now that waveforms have been conveyed to channel One and Channel Two, the next step is to choose one of them and adjust the time base, using Auto, to get the best display. Then we press F4 to save the desired waveform. We press F5 to exit the reference waveform.
Another useful function of the Siglent SHS 1102 hand-held oscilloscope is Recorder, accessed by pressing the bottom of the three large buttons on the left side of the front panel below the display. Pressing the Recorder button brings up the Recorder menu at the bottom of the screen. The first menu item on the left is Scope Trend Plot. Pressing F1, the associated function button, puts the instrument into the Scope Trend Plot mode.
The two utility waveforms, one the inverse of the other, are connected to the two analog inputs and are plotted as trends. They appear as line graphs that travel across the screen. Time is represented horizontally as the leading point moves slowly across the display, ending at the right side.
When Parameter A and/or Parameter B is set as volts, amplitude is represented vertically. Once the lines reach the right of the screen, the motion is no longer readily apparent unless the amplitude is changing. Then it is seen as a series of steps rising or descending as the case may be.
Parameters A and B for Channels One and Two may be set as volts or frequency. Volts will be shown as peak-to-peak, RMS, maximum, and other modes; frequency and phase are the other possibilities.
The Trend Plot user interface shows the current recorded time, the percentage of recorded data in the entire memory, the value of latest recorded data at points A and B, the real time, the sampling time of the cursor point, the parameter measurement of the cursor point and the vertical scales of the two channels.
The Scope Trend Plot functions as shown in Menu One include:
• Trend Plot > Restart, which quits the current data and begins to start the record afresh.
• Parameter A/B, which chooses the parameter to be measured, including voltage, time and delay measurement.
• Run/Stop, which continues or stops recording data
• Next Page, which enters the second page of the menu.
• Display Mode (Normal), which displays data up to the current time.
• Display Mode (View All), which displays all data in compressed form.
• Manual (Off), which records data automatically.
• Manual (On), which records data manually.
• Waveforms, which enable memory data transfer to an exterior device.
• Return, which reverts to the oscilloscope interface.
• Next Page (Page 2/1), which returns to the first page of the menu.
Thus, to use Trend Plot, first choose a measurement in Scope or Meter mode. Then choose the recorder function from the waveform recorder main menu. To open the main menu, press Recorder and then choose from the main menu Scope Trend Plot, Scope Recorder or Meter Trend Plot.
The operation steps are:
1. Input a signal to Channel One, Channel Two or both.
2. Press Recorder to enter the recorder main menu.
3. Press F1 to choose Scope Plot.
4. Choose measured parameter A or B and start recording the Trend Plot.
5. Press F5 to pause or continue recording.
6. Press Return to exit Trend Plot.
To use the waveform recorder, enter recorder main menu under the scan time base, then press F2 to choose Scope Recorder.
The waveform recorder functions are:
• Record, which records the waveform without a gap.
• Replay, which replays the recorded waveform.
• Option, which allows the user to set the parameters of the waveform recorder.
• Return, which exits the waveform recorder.
The Waveform Recorder saving mode function memory is used as follows:
• Start begins to record the waveform.
• Replay permits the user to view the recorded waveform
• Copy permits the user to copy the waveform saved in the memory to a USB flash disc.
• Save mode permits the user to save the record.
• Return exits the submenu and returns to the waveform recorder main menu.
The Waveform Recorder replaying mode menu contains these functions:
• Stop/Continue pauses or continues playing the waveform automatically.
• Restart replays the waveform.
• Return exits the replay menu.
There is also a Waveform Recorder setting menu, which allows the user to set viewing modes including full- and split-screen, continuous and single record mode and point or frame replay mode.
Trend Plot and Recorder can be used for either the Scope or Meter mode. Both these are valuable for analyzing signal parameters as a first stage in troubleshooting and product modeling.

Leave a Reply
You must be logged in to post a comment.