Traditionally, only the spectrum analyzer was capable of displaying electrical and electromagnetic signals in the frequency domain and the oscilloscope took control of the time domain. More recently, each instrument has become competent in the other’s territory. But this overlapping tendency is far from absolute. Oscilloscopes, working in the Math>FFT mode, have always had a slower sample speed, and creating a time-domain display in a spectrum analyzer, while feasible does not provide the user with the processing and memory features available in a contemporary digital oscilloscope. Moreover, in sweeping the spectrum, the spectrum analyzer too frequently missed brief transients. As for the oscilloscope, even laboratory-grade instruments could not venture into the spectrum analyzer’s microwave range.
Meanwhile, communications and other electronic engineers are asking for more test and measurement specifications. The latest spectrum analyzers combine two distinct operational modes. As always, they sweep their spanned portion of the spectrum, but now they pause mid-cycle to permit users to examine small transients subject only to the sampling rate. This enhanced processing mode is the basis for time-domain measurement and display in today’s spectrum analyzer.
To summarize, if it is great bandwidth you require, the spectrum analyzer is better. For versatility and user-friendly operation, the oscilloscope is the right choice. Electronics labs and advanced shops, of course, have one or more of each, and where it can be justified, that is the way to go.
Generally, the spectrum analyzer, given similar specifications, is the more expensive instrument, and greater expertise is required to take full advantage of its many measurement and display capabilities.
In the oscilloscope, the default mode when an electrical signal is applied to one of the analog inputs is the time domain. This mode typically displays a few cycles of the signal under investigation plotted against X- and Y-axes. The two axes, in the most basic implementation, intersect at the center of the screen. The Y-axis is divided into units of amplitude, usually volts or fractions of them, while the X-axis is divided into units of time, usually seconds or fractions of them.
To see an oscillating electrical signal in the time domain, we can use the internal AFG (arbitrary function generator) and apply it to one of the analog inputs. Alternately, an external signal can be applied, using a BNC cable or probe. The appearance of the sine wave accessed from the internal AFG depends on the AFG waveform settings as well as the position and scaling in the oscilloscope display. The user can alter either of them. The first changes the electrical parameters of the signal at the input, while the second does not affect the signal but only the way in which it is displayed. To alter the waveform as synthesized in the AFG, press the soft key associated with Waveform Settings. A vertical menu appears on the right, and the default frequency/period value of 100.00 kHz/10.000 μsec can be changed by turning Multipurpose Knobs a and b. Similarly, pressing the soft key associated with amplitude, the amplitude and offset can be changed by turning the two Multipurpose Knobs.
To change the display settings, in the vertical section turn the appropriate channel position and scale knobs to vary the amplitude display parameters, and in the horizontal section turn the position and scale knobs to vary the time parameters. Notice that neither of these affects the amplitude or frequency as shown in the AFG information bar at the bottom of the display. The sine wave trace is sharp and well-defined, indicating that harmonics are not present.
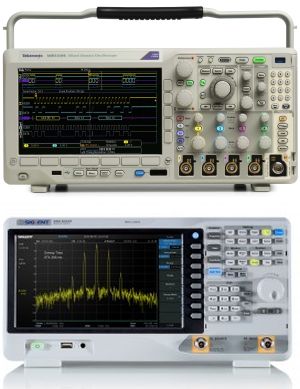
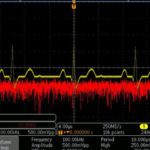
The modern digital oscilloscope is capable of displaying the signal in the frequency domain as well as in the time domain. To see the sine wave in the frequency domain, press Math>FFT. In the Tektronix MDO3000 oscilloscope, time and frequency domain views are shown simultaneously in a single display. This is the meaning of Mixed-Domain Oscilloscope (MDO). Notice that all the power exists in the fundamental, at the left edge of the display. There are no noticeable harmonics. Pressing AFG>Waveforms, we can turn Multipurpose Knob a to scroll down to Square Wave. This waveform is composed of a weaker fundamental, large amounts of the power going into harmonics, now arrayed along the X-axis, which in the frequency domain is configured to represent frequency.
Still in the oscilloscope, we’ll now look at a different frequency-domain display mode. Shift the BNC cable, still connected to AFG Out on the back panel, over to the RF port in the Frequency section. Press RF to turn it on, press AFG and waveform and use Multipurpose Knob a to return to the Sine Wave.
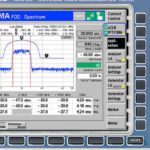
Now we see a different type of frequency domain display, without the MDO-style time domain display shown simultaneously. The two things to notice here are the prominent noise floor and the sine wave fundamental crammed against the left side of the display. The first task in using a frequency domain display is to bring the fundamental to the center of the screen. To do this, in the Frequency section directly below the RF button, press Freq/Span. This brings up the vertical Frequency and Span menu on the right side.
The problem with the initial frequency domain display is that the fundamental is in a quite different part of the spectrum, as opposed to Center Frequency. So, making note of the 100.00 kHz signal as shown in the AFG information bar, enter that value in the Center Frequency field, using the keypad rather than tediously turning Multipurpose Knob a.
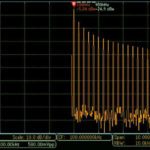
That brings the single fundamental spike to the center of the screen, and as with all pure sine waves, there are no discernable harmonics. Next, press AFG>Waveform and use Multipurpose Knob a to scroll down to square wave. There should be lots of harmonics but we don’t see them because Span is too great. Returning to Freq/Span, reset Span to 5 MHz and press Menu Off to get a clear view. Now we see the many harmonics diminishing in amplitude as their frequency gets farther from the fundamental. This amplitude is shown as decibel units of power rather then volts as in the time domain.
So this is the basic procedure for getting a good frequency domain display by setting Center Frequency and Span. Start and Stop are set automatically to conform to Span, so to begin you don’t need to touch them. The same menu is used in bench, PC-type and hand-held spectrum analyzers, and modern oscilloscopes have this spectrum analyzer functionality.
Both swept-spectrum and real-time spectrum analyzers display amplitude as power on the Y-axis and frequency distribution on the X-axis. They differ in how they do this. The difference between the two is in how the information is processed and in their relative abilities to process signals at the high end of the frequency spectrum.
The swept spectrum analyzer uses heterodyne technology to continually sweep the span of interest, down-converting it to a lower frequency just as a superheterodyne radio receiver down-converts a range of RF frequencies to a single IF frequency to simplify multiple stages of amplification. This makes a lot of sense, but it has the disadvantage that the instrument does not evaluate all frequencies within the band in precise real time. From the point of view of the user it is slow, working best only with steady-state repetitive signals.
The real-time spectrum analyzer avoids this limitation because it displays all signals as they happen. One implementation is the parallel-filter spectrum analyzer, which consists of numerous band-pass filters, accounting in part for the higher cost of this instrument.
In spectrum-analyzer design, there is always the effort to lower the noise floor, so lower-amplitude signals can be displayed and measured. One way to do this is to reduce the resolution bandwidth, but this modification boosts the amount of time required to sweep the portion of the spectrum defined by the span.

Leave a Reply
You must be logged in to post a comment.