A bevy of specifications define how spectrum analyzers perform. But just a handful of qualities can be pivotal when it comes to selecting instrumentation.
Contributed by Signal Hound
As wireless technologies pervade our lives, more engineers find they must make RF measurements. In the past, RF testing required the use of expensive equipment handled only by engineers with deep RF knowledge. Today, however, engineers and technicians with a wide range of backgrounds must measure RF.
 Spectrum analyzers are the most common lab instrument for measuring RF signals. Historically, these have been expensive instruments protected by the resident RF guru. But advances in RF integrated circuits have made it possible to push the envelope in spectrum analyzer architecture. Many companies are surprised to learn that modern RF instrumentation needn’t be expensive. Today, the approach is often to buy one physically large and costly spectrum analyzer for a few challenging requirements and then stock every bench with less expensive PC-based analyzers that can handle 95% of the workload.

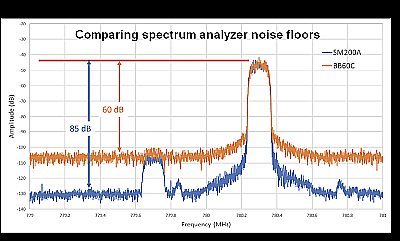
Dynamic range is an important specification for any spectrum analyzer. When looking for low-level signals, it determines your ability to distinguish a signal from the noise floor. An important consideration will be determining the lowest level your test situation demands. For many measurements, the main objective may be to accurately characterize the main signal. In these cases, a 60 dB signal-to-noise floor may be more than enough. In some labs, a few test stations may require a more expensive spectrum analyzer that offers 85 dB or more.

Spectrum analyzer dynamic range specifications can be confusing. Often, instruments display a low number for DANL, or Displayed Average Noise Level (e.g., less than -150 dBm/Hz). The DANL numbers can sometimes be misunderstood, as they depend on many factors such as frequency, attenuation, detectors, preamps, etc.
For a simple comparison among spectrum analyzers, look at the maximum dynamic range specified as two-thirds of the difference between the third-order intercept point and DANL at 1 GHz.
In many applications, sweep speed is of critical importance. For example, spectrum-monitoring situations

often require broad frequency sweeps in search of a variety of signal situations. For example, Signal Hound’s SM200B offers a 1 THz/sec sweep speed at any of its resolution bandwidth settings ≥30 kHz. Covering 1 GHz to 20 GHz in just 19 msec allows for a constant sweep of the airwaves. Best of all, this can take place automatically, with no operator present, over long periods of time. Simply define a baseline and any signals that violate it will be logged to a CSV file in real-time. This maximizes both efficiency and security, as data is preserved even if the computer shuts down.
The Signal Hound spectrum analyzer architecture also allows for an additional technique to further boost speed. In many cases the instrument software can consume computer processor overhead. An application like Signal Hound’s Spike spectrum analyzer software may have a small impact on overall test times. In cases where fractions of a second are critical, Signal Hound allows its users to bypass Spike to allow for direct device API programming and faster measurements. Signal Hound spectrum analyzers can be programmed in C++, LabView, Matlab, Python, C# or any language that has C bindings.
Phase noise measurements
Many devices and systems require accurate phase noise measurements. Spectrum analyzers are commonly used for this measurement. However, the spectrum analyzer itself must have phase noise sufficiently low so as not to contribute to the device measurement.
For example, the Signal Hound SM200B uses a low-IF architecture design that enables exceptional phase noise performance, comparable to the performance of a more expensive spectrum analyzer. The Signal Hound SA44 and BB60 use a more traditional superheterodyne architecture to achieve a more modest phase noise performance but less expensively.

The low-IF architecture of the SM200B does come with a trade-off of higher image response spurs. While the residual response spurs are comparable to the MXA, the image response spurs are not as low as those of the MXA (<-74 dBc). The SM200B Spike software provides a Signal ID feature able to be activated and deactivated, allowing the differentiation of low-level mixer spurs from RF Input signals. In many cases the spurs can be identified as coming from the spectrum analyzer and not the device-under-test (DUT), allowing them to be ignored during the actual measurement. The more traditional superheterodyne architecture of the BB60C typically has -70 dBc image rejection. The BB60C spurs are generally not from the image response.

For many real-world signals—from complex modulated communications signals, to interference events, to pulsed tactical signals—the signal energy can be sporadic, non-recurring, or even random. With traditional spectrum analysis, it could be nearly impossible to catch these signals in an analysis window and trigger on them. Modern communication modulation schemes are increasing the challenge further with techniques such as frequency hopping, spread spectrum, pulsed, and cognitive radio low probability of intercept techniques.
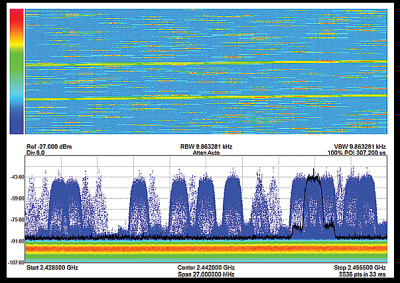
Real-time spectrum analysis (RTSA) is a digital signal processing method that leverages overlapping FFTs and high-speed memory to have a 100% probability of intercept (POI) in even extremely dense environments. Real-time bandwidth, which is the maximum frequency span offering gap-free overlapping FFT processing, is an important parameter of an RTSA that can enable a more detailed analysis of a spectrum.

Real-time no longer equals expensive when it comes to PC-based spectrum analysis. For example, Signal Hound offers RTSA capabilities up to 160 MHz with a 100% probability of intercepting signals as fast as 12-µsec. However, in many cases you don’t even need 160 MHz of analysis bandwidth. For example, suppose you are testing a device having a 25-kHz maximum bandwidth signal, such as a key fob. You may just need to push the key and make sure that the center frequency, bandwidth, and modulation are right.

Complex signal analysis capabilities include adjacent channel power ratio (ACPR) or adjacent channel leakage ratio (ACLR), occupied bandwidth (OBW), and channel power measurements. For example the 27 MHz of instantaneous bandwidth provided by devices such as the BB60C enables real-time OBW and ACPR measurements of very wide-bandwidth signals, transient or continuous. For applications where you need more instantaneous bandwidth, the SM200B offers 160 MHz.
Another consideration is the separation of the hardware systems. Traditionally, test instrumentation utilizes a built-in PC taking the form of special internal controller boards produced at a much lower volume than commercial PCs and typically manufactured by a third-party. It is not unusual for these internal controllers to be two to five generations behind their commercial peers because they are embedded. This invariably means that by the time the spectrum analyzer reaches the market, the internal controller is dated.
Additionally, these built-in controllers are usually only updated when the instrument is replaced – meaning that by the end of an instrument’s life cycle, the user is dealing with a processor that is several generations slower than current PCs. The ability to use a current-generation PC will keep the overall performance of your test equipment much closer to current standards.
Now factor in the cost of the traditional internal controller and mark it up by at least four times the vendor’s cost to arrive at the customer’s cost. USB-based test instruments eliminate this issue with the use of an external PC as the measurement controller. And of course, use of an external PC to control the measurement allows all collected data to reside on the PC.


Leave a Reply
You must be logged in to post a comment.