There’s a trick with a soldering iron that can be used to determine whether an unidentified semiconductor is n-type or p-type. In essence, it determines whether the majority carriers are holes (p-type) or electrons (n-type). Just as heat makes a gas expand (PV=nRT), the hot tip of a soldering iron makes carriers expand away from the hot contact point. The charge of the dominant carrier species (electrons or holes) determines the direction of the net current flow.
Charge carriers, electrons in p-type, holes in n-type, then migrate away from the lead to which heat is applied. That is because the heated probe creates a greater number of charge carriers, which because of mutual repulsion move away from the heated area. The result is a voltage differential. Thus if the soldering iron tip is connected to an n-type sample, a positive reading will appear. The reason is that the thermally excited free charge carrier moves toward the unheated probe.
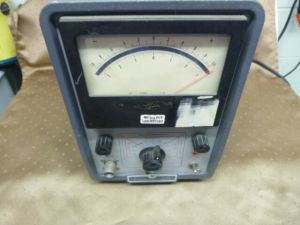
The only problem with this technique is that the currents created are super small–typically in the micro or picoamp range. So you need a good microvolt-amp meter to actually see the effect.
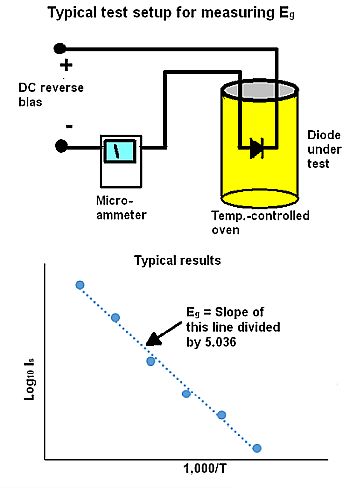
Heat can also be used to determine not just the n or p in semiconductors but also whether the semiconductor is based on silicon or on wide bandgap materials such as silicon carbide or gallium nitride. The basic approach is to reverse=bias a semiconductor diode in a temperature-controlled oven while monitoring its reverse current. The reverse saturation current, Is is the function of temperature (T) of the junction diode. For a small range of temperatures, the relation is expressed as 10 = C − (5.036 × 10³/) where C is a constant, T is in °K and Eg is the band gap in electron volts, eV. The graph between 103/T as the abscissa and log10 Is as the ordinate will be a straight line having slope S = 5.036 Eg. Hence the band gap = /5.036.
To see where this relationship arises, first a quick review: Electrons in atoms occupy and move about shells representing discrete energy levels (probability clouds). The electrons in the outermost, or valence, shell are most active, dropping to lower energy levels or escaping the atom altogether and leaving the valence band partially filled with varying numbers of electrons.
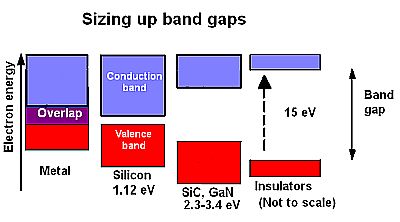 What interests us here is the behavior of the free electrons after they escape the valence band and head toward the conduction band. What happens depends upon the material i.e. whether it is a conductor, semiconductor or insulator. The energy an electron needs to escape the valence band and reach the conduction band is called the band gap. Though band gaps are often depicted in a manner like the near-by diagram, the band gap is not actually a spatial structure; this is a pictorial representation of the amount of energy needed for the electron to break free of its bound state in the valence band and move into the conduction band. In reality, the band gap is an energy gradient that the charge carrier must traverse before it can play a role in electric conductivity.
Sometimes the valence and conduction bands overlap, in which case there is no bandgap. If this is the case, the material is an electrical conductor. In a band gap, no electronic states can exist. (Thus the term bandgap).
As temperature rises, the band gap energy in semiconductors drops. We can determine the energy band gap of a semiconducting material by noting how its conductance varies with temperature. In reverse bias, the current flowing through the PN junction is quite small. When the PN junction is placed in reverse bias, current flows through the junction only because of minority charge carriers. The concentration of these charge carriers depends on band gap Eg. The saturation value Is of reverse current depends on the temperature of the junction diode: = A (Nn e vn + Np e vp ) −/T where Nn is the concentration of electrons and Np is the concentration of holes in the n or p-type region, vn and vp are the drift velocities of electrons and holes respectively, A is the area of the junction, k is Boltzmann’s constant, 1.38×10⁻²³ J/K; T is the absolute temperature of the junction, and e is the magnitude of the electron charge.
 You can solve this equation for Eg. The intervening steps are a bit involved. For our purposes, we can say solving this equation for Eg yields the relationship = /5.036 mentioned previously.
The typical way of determining Eg using this relationship employs a precision oven and a micro-ammeter. The diode of interest sits in the oven and is reverse biased while the micro-ammeter monitors its current. The usual approach is to bring the oven up to about 100°C, switch it off, and start taking diode current readings as temperature falls. The procedure is often repeated for different values of diode reverse bias voltage. Then the resulting current values are plotted on a graph between log10Is and 103/T for the different reverse-bias voltages. The resulting graph should be a straight line that slopes down with rising temperatures. The slope of that line should equal the band gap energy in electron volts.




Leave a Reply
You must be logged in to post a comment.