Today’s electronic devices with fast FPGAs, ASICs, and other ICs rely on ever-smaller power rail voltages with tight tolerances. Engineers who incorporate these ICs into their systems need to use oscilloscopes, probes, and measurement techniques that align with today’s tight voltage rail tolerances.
Making an accurate ripple measurement with an oscilloscope on a 1 V power rail with a 2% tolerance can be difficult. An oscilloscope’s noise floor can get in the way. You can, though, make fast and accurate power-integrity measurements with oscilloscopes using hardware and software tools.
Noise comes not only from the oscilloscope but from probes and probing accessories. Most oscilloscope manufacturers publish typical RMS noise values for specific models. Figure 1 shows a typical oscilloscope measurement of a DC power rail. You can see the noise, which is a characteristic, not a specification, of the oscilloscope. Moreover, manufacturers only publish typical RMS noise values, but peak-to-peak noise values matter for accurate ripple measurements.

Start by checking the instrument and the accessories that you will use for the measurement instead of relying on published values. A quick characterization takes just a few minutes and requires no external equipment. Disconnect all inputs from the front of the oscilloscope, turn on a peak-to-peak (VPP) measurement, set the vertical scale and sample rate that you will use for the proposed measurement, and let the oscilloscope run until it gives a stable and consistent VPP noise value. Noise levels are dependent on the vertical sensitivity setting, the bandwidth setting, and the path selection (50 Ω or 1 MΩ) and will vary slightly from channel to channel on the same oscilloscope.
Vertical scale and bandwidth settings
Noise is a function an oscilloscope’s full-screen vertical value. Thus, using a more sensitive vertical resolution will reduce the amount of total noise measured. Furthermore, scaling the signal to fill most of the vertical grid space uses more of the oscilloscope’s ADC resolution, which makes VPP measurements more accurate. Turning on bandwidth limit filters also reduces broadband noise, additionally improving the accuracy of power-rail measurements. There is, however, a trade-off. Higher-frequency anomalies are hidden if you set the bandwidth limiting too low.
What is the right bandwidth to use? That depends on the signals. While switching speeds in power supplies may be at kilohertz or low megahertz frequencies, fast edges produce harmonics that can go high into the megahertz range. Higher frequency coupled signals, including clock harmonics, need more bandwidth to capture these higher frequencies. Figure 2 shows noise in the time domain and its frequency distribution.

Use the right probe
All major oscilloscope manufacturers offer power-rail probes that incorporate several attributes to make them superior to standard probes. Power-rail probes let you make accurate measurements on small voltages with tight tolerances. This includes the probes’ minimal DC loading impact on the power rail, built-in offset to take advantage of small vertical scaling, and a 1:1 attenuation ratio to minimize noise. Probing power rails with a direct SMA or soldered 50 Ω SMA pigtail coax delivers the lowest noise.
You might be tempted to use the ever-readily-available passive probes that ship standard with oscilloscopes for power rail measurements. These probes have a 10:1 attenuation ratio and hence will produce roughly ten times more noise than a 1:1 probe.
If you choose to make a quick measurement using a passive probe across the blocking capacitor, then use a ground that minimizes ground loop area, such as a ground spring. Doing so improves measurement accuracy by reducing the long ground loop that picks up noise. Figure 3 shows how soldering a coax cable directly across a bypass capacitor results in the shortest possible ground loop and thus minimizes noise from a probe.

Use the frequency domain
Characterizing power rails typically involves ensuring there are no unwanted signals coupled onto the rail. That’s where signal integrity affects power integrity. Using an oscilloscope’s spectrum analysis provides a much better method than looking at the rail waveform in the time domain.
As rail voltage is directly related to the rail’s impedance response, evaluating both signal integrity and power integrity in the frequency domain can shed light on the relationship. Required bandwidth for frequency domain views depends on the potential signals including clocks and potential emissions that may couple onto the power rail. Coupled signals tend to pop out in the frequency domain.
Try looking at the signal integrity and power integrity relationship. A power rail is typically shown as a flat waveform where you measure the peak-to-peak voltage. For clock signals, you often measure jitter. In the time domain, these two elements don’t appear to have a direct relationship. The relationship gets interesting when you look at clock jitter and rail voltage independently in the frequency domain. Plotting a log-log spectrum of the power-rail voltage shows that most of the energy is at lower frequencies as shown in Figure 4. This relates to the impedance of the rail.

Oscilloscopes measure a clock signal’s jitter by comparing the rise and fall times of each clock period, or time-interval error (TIE). The oscilloscope can plot this value, from which you can then apply a log-log spectrum to the TIE measurement. Remarkably, the spectrum of the clock’s TIE and the spectrum of the power rail voltage match shape almost identically. Changes to the power-rail impedance will show equally for both the clock’s TIE spectrum and the power rail-voltage spectrum at similar frequencies.
Histograms accelerate measurements
Finding the worst-case amplitudes is a key element of measuring power rails. Getting high-confidence results often necessitate hundreds or thousands of measurements across an extended time window. Power integrity is all about finding outliers. How much measurement time is needed? More measurement increase confidence.
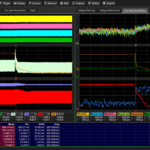
Unlike just about any other oscilloscope measurement, power integrity doesn’t require a trigger. Many oscilloscopes incorporate a less common trigger mode known as free run (Figure 5). With the trigger set to free-run mode, the oscilloscope captures data, processes the data, and captures the next acquisition without waiting for a trigger event. The trade-off is that the acquisition won’t occur at the same point of the waveform each time. It’s not needed. Free-run trigger mode yields a waveform update rate dramatically faster than in auto or normal trigger modes.

Many oscilloscopes offer a less commonly known feature called waveform histogram (Figure 6). The instrument computes all waveform values and produces a corresponding histogram that shows what vertical values occurred in the waveform and the percentage of acquisition samples at a specific amplitude. In a sense, histograms are very compact representations of waveform amplitude values at each sampled point. The histogram does not retain the detail related to the shape of each waveform, but rather just the vertical values. This is exactly what is needed for power-integrity measurements.

Why should you use a histogram? For voltage tolerance testing, the shape of the waveform is not important, but the minimum and maximum values matter. Ripple, noise, and disturbances present themselves as anomalies that exceed voltage-tolerance levels. A histogram is a great visualization tool to see if tolerance levels have been violated.
With waveform histograms, oscilloscopes can measure 20 times faster than using a VPP measurement on each acquisition.
Industry dynamics drive decreases in rail voltage values and tighter tolerances. Choosing the right equipment and applying techniques to reduce measurement noise and speed testing makes the task more accurate and faster.


Leave a Reply
You must be logged in to post a comment.