The choice of power sensor and meter greatly depends on the qualities of the signal being measured.
Bob Buxton, Boonton Electronics
Today’s complex modulation schemes and pulsed communication modes have brought the need to measure RF power ever more accurately and efficiently. There are multiple technologies available for the measurement of RF power, falling into four categories:
Thermal: Measuring the heating effect of RF power upon a sensing element.
Diode detector: The RF signal is rectified or “detected” to yield a dc voltage proportional to the signal amplitude.
Receiver: A tuned circuit receives the signal to allow measurement of its amplitude component.
RF sampling: The RF signal is treated as a baseband ac signal and is directly digitized.
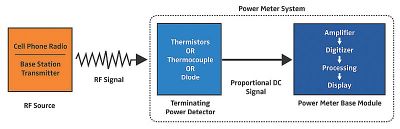
Thermal and detector type measurements are “direct sensing,” where the amplitude of the RF signal applied to a load element is converted to an easily measured dc quantity. This RF-to-dc conversion typically takes place close to the signal source via a small converter probe known as an RF power sensor that connects to the device under test (DUT).
We will consider in detail detector-based direct sensing. A power meter may display a variety of results such as average or peak power and automatically measure parameters such as pulse rise/fall times, pulse width, pulse repetition interval (PRI), and more. Power meter/sensor combinations may be classed as CW, average, or peak. Displays may be numerical or graphical, displaying the power-time profile of a signal.
Traditional benchtop systems employ a sensor that provides an analog signal to the power meter. But today there are also USB-connected sensors where all detection and digitization takes place in the power sensor which transmits digitized data to the power meter over USB. Traditional analog-connected systems require calibration because the analog signals can vary slightly with temperature. In a USB-connected sensor, temperature compensation takes place in the sensor. The digital connection is unaffected by temperature variations, so a calibrator is not required. A USB sensor may be used with a power meter for a dedicated benchtop experience, or with a PC and analysis software.
When settling on a technology for RF power measurement, there are a few basic questions that require answers.
What are the minimum and maximum carrier frequencies?
What is the minimum and maximum expected power level (i.e. dynamic range)?
Are connections coaxial or via a waveguide?
Is the characteristic impedance 50 Ω, or something else?
Is the carrier CW or modulated via pulse, analog, or digital modulation?
Similarly, is the video bandwidth narrowband or wideband?
If the signal is pulsed, how fast does it rise?
Next, consider the signal measurements that might be required: Just average levels? Peak information (peak-to-average power ratio)? Time-domain measurements (pulse profiling and automated pulse measurements)? Will there be a statistical power analysis?
Decisions that may be less obvious arise from the type of signal being measured: CW, modulated, or pulsed. Several questions in this area arise frequently from users:
Q: I want to measure average power. What type of sensor should I use and how would I know that I have sufficient video bandwidth for my measurement?
A: For average power measurements a suitable sensor would be a thermal or a real-time true average power sensor. Because the measurement result is an average over time and there’s no need to track the signal profile, the amount of video bandwidth is unimportant. Sensors are available that can deliver 100,000 measurements per second.
Q: I need to make pulse power measurements, but I have heard that there are multiple types of pulse power measurement. What do I need to know about this measurement?
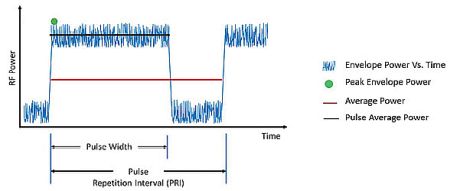
A: Envelope power is the amplitude change due to modulation or distortion as a function of time, averaged over one or a few cycles of the RF carrier signal. Peak envelope power (PEP) is just the highest peak amplitude due to modulation. Pulse average power is the average power level during the pulse. And the average power is the total power over the pulse repetition interval, which includes both the signal burst and the time interval leading up to the next pulse.
Using these distinctions, other derived measurements can be determined as well (principally, crest factor). Crest factor is defined as peak-to-average-ratio (PAPR). From this definition, crest factor can be the ratio of the PEP to either the average power over the PRI (Crest Factor = PEP/Average Power) or only during the pulse (Crest Factor = PEP/Pulse Average Power).
To make these measurements it is necessary to use a peak power sensor with a peak power meter or a USB-connected peak power sensor with either a meter or analysis software running on a computer. Some systems can also make a series of automated pulse measurements such as rise/fall time, overshoot, droop period, duty cycle, off-time, duty cycle, and more. Some can make measurements on multiple pulses in a burst.
Q: I need to measure a pulsed signal and the power sensor datasheet mentions “video bandwidth,” “continuous sample rate,” and “effective sample rate.” What’s the relevance of these parameters?
A: When measuring pulse signals there are three particularly important things to consider: pulse rise time, minimum pulse width to be measured, and the time resolution required.
Rise time is determined by the video bandwidth (VBW). Rise time ≈ 0.35/VBW. A sensor with 195 MHz VBW would be suitable for rise/fall time of about 2 nsec. However, such a sensor would probably be specified at the more conservative rise time of less than 3 nsec.
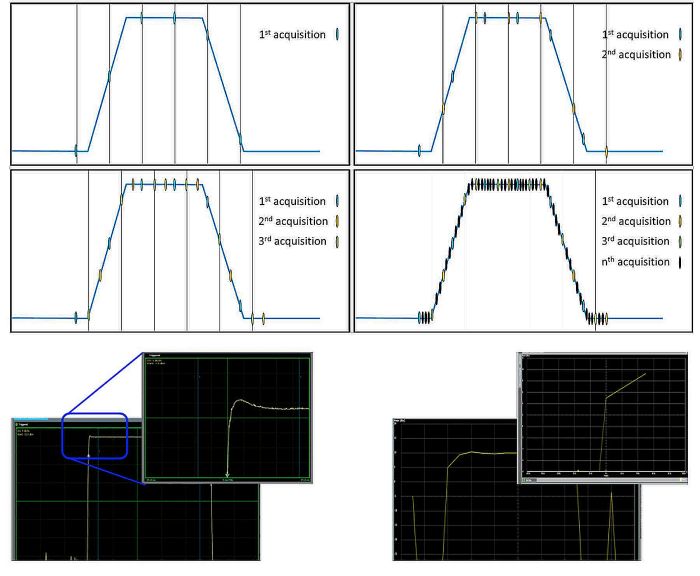
The terms “continuous” and “effective” sample rate are relevant for sensors that use Random Interleaved Sampling (RIS), also called Repetitive Random Sampling (RRS). In equivalent-time sampling, a picture of a waveform is created over time by using a series of samples taken from repetitive waveforms. RIS is a form of equivalent-time sampling that boosts the apparent sample rates of repetitive signals by combining several triggered waveforms. Because the trigger time happens randomly for each sample acquisition, the digitizer samples different points in the waveform on consecutive acquisitions. By combining these waveforms, RIS sample rates can be up to 100 times higher than the ADC sample rate on the digitizer.
Power sensor/meter combinations and USB power sensors are available that have sample rates up to 100 MSa/sec. The minimum pulse width is determined by the continuous sample rate. To ensure that at least one sample coincides with the pulse, the pulse width cannot be less than the time between samples. For a continuous sample rate of 100 MSa/sec, that corresponds to a minimum pulse width of 10 nsec.
The effective sample rate is determined by the resolution of the random delay from the trigger point. For a sensor with an effective sample rate of 10 GSa/sec this means a signal may be measured with a time-base resolution of 100 psec.
Q: Can I assess the linearity of my amplifier using a power sensor and meter?
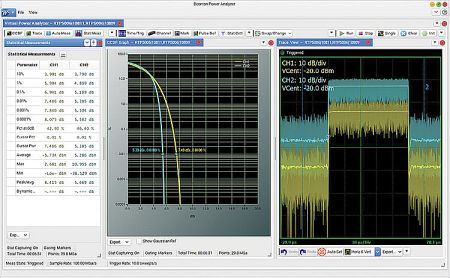
A: Yes. The key is to select a power meter/sensor combination or a USB-connected sensor that can make statistical measurements such as crest factor and complementary cumulative distribution function (CCDF). Performing these measurements on the amplifier input and output signals makes it possible to see at what point distortion starts. Boonton’s Testing High Power GaN Amplifiers for Radar Signals using Peak Power Meters contains more information on statistical measurements.
In summary, CW, average, and peak power sensors and meters all have their place. However, if multiple types of power measurement are needed and budgets allow only one type, the peak power sensor and meter may be the best choice because it can make all three major types of measurement.
References
Principles of Power Measurement, A Reference Guide on RF & Microwave Power Measurement
What Do You Want to Measure – Peak or Average?
Testing High Power GaN Amplifiers for Radar Signals using Peak Power Meter


Leave a Reply
You must be logged in to post a comment.