What is a harmonic? A harmonic of a repeating wave is a wave with a frequency that is a positive integer multiple of the original, known as the fundamental frequency. The original wave is also called the first harmonic, and the following harmonics are known as higher harmonics.
With regard to a 60-Hz electrical system, second-order harmonics are seen at 120 Hz, third-order at 180 Hz and fourth order at 240 Hz. They continue in this manner, containing less energy as the integer multiples rise and as they extend farther from the fundamental. In a three-phase system, only odd-order harmonics (third, fifth, seventh and ninth) appear.
Harmonics can be visualized and comprehended more readily when the waveform is depicted in the frequency domain rather than in the time domain. In the frequency domain the X-axis represents frequency rather than time. The Y-axis in both domains represents amplitude, but in the frequency domain it is expressed in units of power rather than volts.
In accord with Joseph Fourier’s work in connection with heat transfer, any non-sinusoidal waveform can be decomposed into a number (sometimes a large number) of sine waves. In the frequency domain, they are shown as discrete amounts of energy appearing at frequencies which are whole integer multiples of the fundamental.
The frequency domain can be displayed either on an oscilloscope, using the Math/Fast Fourier Transform mode, or on a spectrum analyzer. It is important to measure and quantify harmonics because they are almost always harmful and identifying them is the first step in mitigating them.
To musicians harmonics are good. Musically, the sine wave has an unpleasant sound, becoming particularly painful at high volume. Because a sine wave contains no energy in harmonics, the entire acoustic energy is concentrated at a single frequency, which makes it hard to process. Various musical instruments have unique harmonic signatures, comprised of the comparative intensity at each whole-integer frequency, and this is what differentiates them from the tuning fork, with its harsh sine-wave sound.
Musicians can intentionally produce notes that would otherwise be beyond the capabilities of the instrument. A guitarist, for example, can create ethereal chime-like sounds by lightly fretting the string, which has the effect of damping the fundamental so only the higher-pitched harmonic is heard. Flute players can similarly play isolated harmonics by tightening the aperture, which increases air speed. Bugles, which have no individual valves, rely on harmonics to produce simple tunes with no fingering.
Electrical engineers, in contrast, deploy an array of strategies to eliminate or at least suppress harmonics where possible to reduce the possibility of harmful effects in distribution systems and end-use equipment. Harmonics that infiltrate electrical circuits result from a variety of sources. These can be part of the generation and distribution process or they can be caused by loading.
A generator, for example, can produce fifth-order harmonics resulting from magnetic flux distortions in the vicinity of the stator slots and also non-sinusoidal flux distribution at the air gaps. Harmonics can also arise from iron-core transformers driven close to saturation, at which point the output becomes non-linear, conforming to a hysteresis curve and characterized by a damaging third harmonic.
Non-linear loading is a significant source of harmonics. In a simpler age, brushes arcing in motors were the primary source of electrical distortion. But today electrical loads include fluorescent ballasts, rectifiers, inverters, variable frequency motor drives, welders, arc furnaces, voltage controllers, frequency converters and switching power supplies. All of these contribute to a significant non-linear electrical environment wherein harmonics flourish. Harmful effects include overloading of neutral conductors in three-phase systems and overheating and cutting out of powerful motors.
The first step in mitigating the harmful effects of harmonics is to display the waveforms involved and ascertain the extent of harmonic content. This process can involve either of two instruments, an oscilloscope or a spectrum analyzer. Both instruments are well suited for evaluating power quality, but the spectrum analyzer — though it cannot display signals in the time domain — has special features that help define harmonic content in a precise and comprehensive manner. A well-equipped lab or advanced shop will have both instruments.


Connecting our Siglent waveform generator to a Tektronix MDO3104 oscilloscope, a 10 MHz square wave signal is displayed in the time domain. Then, to see this signal in the frequency domain, we first press the Math button, then the soft key associated with FFT.
Because of the fast rise and fall times characteristic of the square wave, this signal has powerful harmonics, and these appear in the frequency domain. Moving farther in frequency from the fundamental, the power of these peaks diminishes and this relationship is clearly shown in the frequency domain display.

With the presence of the harmonics revealed, their measurement involves first connecting the Siglent AWG output to a Siglent SSA 30323X spectrum analyzer. At first, the signal doesn’t display. At this point, many first-time spectrum analyzer users are perplexed because the only thing visible is a rapidly fluctuating noise floor across the screen.
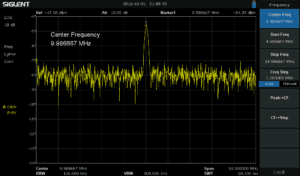
The fact is, to display a signal in the spectrum analyzer, one must be aware of the geometry of the acquisition with respect to the signal at the input. First verify that the signal coming over from the AWG is 10 MHz. The amplitude should be set fairly low to ensure the spectrum analyzer ADC is not overloaded. Two volts peak-to-peak would be too high. Two millivolts peak-to-peak is better. Then, in the spectrum analyzer, press frequency and, using the keypad, set Span at 20 MHz. Center Frequency will go to 10 MHz, Start Frequency will be at 0 Hz and Stop Frequency will be at 20 MHz. Always start with Span. If you begin with Center, Start or Stop, the figures will keep jumping around to accommodate each other, and you won’t be able to set them as required.

Now we see the fundamental displayed at the left of the screen.
To see the signal more clearly in this frequency display, press Peak>CF. The instrument then detects the highest peak and reconfigures the display so the fundamental sits in the center of the screen, enhancing readability.
Now we see a good display. Still, no harmonics appear. The reason is because they are integer multiples of the fundamental, they are beyond the scope of the instrument as the display is currently configured. To see these harmonics, make the Frequency Step 10 MHz. Then, start pressing the Up button. You will see that the portion of the spectrum that is displayed shifts so higher frequencies move into view.
Soon we see a harmonic, a smaller-amplitude peak in comparison to the fundamental. Continuing to step up the spectrum, additional lower-amplitude harmonics can be found until they disappear below the noise floor.
A problem may arise when you start pressing the Up button. Rather than changing the display to show higher frequency portions of the spectrum, it causes the step frequency (or whatever frequency parameter is currently highlighted) to rise. This rise in step frequency can be reversed by pressing the Down button an equal number of times to restore the desired parameter value.
Press the Frequency button. The Up and Down buttons will now cause this portion of the spectrum to shift in the display, so the user can find the harmonics. When a harmonic is located and brought to the center of the display, press the Measure button. This brings up the Measure Menu, and it will be seen that Measure is currently off. To turn it on and also to select the measurement type, press Spectrum Monitor. The harmonic appears at the center frequency. At the bottom of the screen, an interesting graphic shows the energy distribution, using warm and cool colors with a key just above. When we step back to the fundamental, the Spectrum Monitor shifts accordingly. It also moves upward slowly, indicating that time is represented on the vertical axis of the primary trace.

You might expect that when the Frequency button is pressed, the display will revert to the primary frequency domain view, but no, this does not happen. To get back to the beginning, instead press Auto Tune.

Leave a Reply
You must be logged in to post a comment.