Matlab was released in 1984 by Mathworks, an American privately-held corporation whose other major product is the closely-related Simulink. Additionally, Mathworks offers close to 100 other programs, such as Polyspace, SimEvents and Stateflow.

Matlab’s main focus is numerical computing, including matrix and algorithm operations, plotting of data and functions and creation of user interfaces. It is capable of interacting with outside programming languages, such as C, C++, C#, Java, Fortran and Python.
One factor that accounts for Matlab’s phenomenal success and enduring wide use among researchers, engineers, and advanced students is its comprehensive and well-designed documentation. Mathworks offers on its website free-of-charge a wide variety of tutorials and training sessions.
The best introduction is Matlab’s Onramp, a free, two-hour online overview course that introduces new users to the Matlab language and shows some real-world examples. The course starts with fundamental Matlab commands, then shows how to import and display data and introduces typical projects for putting this knowledge to work. A user-oriented project that concludes the course involves analyzing light from a star to see whether it is moving towards or away from the earth.
Most of the course interacts with a web-based version of Matlab, in contrast to the desktop versions, which, despite its different superficial appearance, is essentially written in the same Matlab language. The course is divided into simple units that build the user’s knowledge base. After viewing introductory material, the user executes commands by entering them into the command window following the Matlab prompt (>>) and pressing Enter/Return. A star (*) denotes multiplication of scalar numbers.
Matlab focuses on deep learning, computer vision, signal processing, quantitative finance and risk management, robotics and control systems. Deep learning pertains to training networks. A key component in that endeavor is image recognition. Other areas are speech recognition and text analytics. Matlab’s deep learning is interactive with industry-wide products such as Caffee and Tensor Flow-Keras.
The key to training a model is to have access to large databases. In looking at images, for example, the first task is to isolate the object of interest from the background.
Matlab makes it feasible to run through an entire video and separate out a group of pixels or area of the picture. Then, the network can be trained to retain and correlate this information on a case-specific basis. Moreover, Matlab permits the user to monitor the progress of network training to see if it is moving rapidly in the right direction.
Speech recognition and text analytics are important parts of network training. To this end, deep learning interacts with Python, Java, .net, C and C++. Computer vision in Matlab presupposes algorithm development to deal with diverse situations that constantly arise. Matlab and its associated program, Simulink, begin by acquiring the requisite graphics and video from imaging hardware. Video and images may then be used for visualization and manipulation by means of graphical tools that are provided within these programs. Additionally, there are libraries of standard algorithms that enable users to implement designs in embedded hardware.
Signals from a variety of sources may be acquired, measured and analyzed, making use of Matlab and Simulink signal processing resources. These tools allow users to first preprocess and filter signals, then to analyze them for use with data analytics and machine learning. Ultimate goals are to analyze trends and to perceive patterns in signals at the outputs of connected instrumentation.
Matlab and Simulink also are likely to play a central role in robotics with functions that can connect to outside robot operating systems independent of hardware details. This facility works with well-known equipment such as Arduino and Raspberry Pi as well as with older robotics having legacy code.

Matlab helps engineers design and deploy control systems at all stages of development, as in plant modeling and automatic code generation. These tools are quite flexible and able to solve wide-ranging control problems. An example is Arduino support in Matlab. Using the Matlab package for Arduino hardware, Matlab interactively communicates with the board, which can then perform a variety of functions including acquiring analog and digital signals, controlling other hardware using digital and pulse-width modulated signals, driving dc, stepper and servo motors; accessing peripheral devices and sensors via I2C and SPIB or Wi-Fi to communicate with an Arduino board; and building interfaces with hardware and software libraries.
Matlab is a high-level interpreted language. Without delay, the user accesses I/O instructions with no compilation required. There are numerous math, engineering and plotting capabilities so that data from the Arduino is available for timely analysis and display.
Matlab’s Instrument Control Toolbox facilitates control and communication with test and measurement instruments such as oscilloscopes, power supplies, signal analyzers, function generators and analytical instruments. VISA instrument drivers, for example IVI and VXI plug&play, are first required, or alternately text-based SCPI commands over communications protocols such as GPIB, TCP/IP and UDP. Another approach is to control and acquire data from test instrumentation without benefit of code.
Matlab’s Instrument Control Toolbox generates data that may be sent out to an instrument, or it can import data into Matlab, which then subjects it to analysis and display. Tests can be automated, hardware designs verified and test systems built, incorporating LXI, PXI and AXle standards.
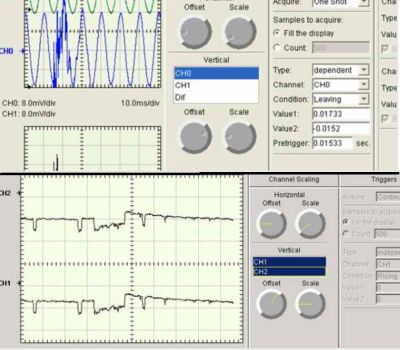
Other computers can be remotely connected to Matlab by means of TCP/IP, UDP, I2C, SPI, Modbus and Bluetooth serial protocols. In all cases, the Mathworks Instrument Control Toolbox requires prior installation of Matlab. The Matlab Instrument Control Toolbox can acquire and control data from an oscilloscope to simplify data analysis and create automated tests. It is also easy to make graphical interfaces.
Referring to the oscilloscope’s operating and programming manuals, data can be acquired and controlled using GPIB, serial, TCP/IP, UDP and VISA interfaces. Matlab’s Instrument Control Toolbax provides connectivity via Matlab Instrument Drivers, IVI and VXIplug&play. Native Matlab instrument drivers to not require the installation of additional drivers. They work on Windows, Linux or Mac operating systems.
IVI instrument drivers are often included when you purchase an oscilloscope, or they are available on the manufacturer’s website. VXIplug&play similarly often ships with the instrument or is available online.
To see how to connect an oscilloscope that is running the Matlab program, first display a waveform in the oscilloscope, for example a 5-V peak-to-peak square wave centered on the X and Y axes. To bring the waveform information into Matlab, install VISA drivers obtained from the Tektronix or National Instruments website. The oscilloscope-computer hardware connection can be over USB, RS-232, GPIB or Ethernet.
In the computer, from the Matlab program, access Test and Measurement Tool, which is included in the Instrument Control Toolbox. Expand the Hardware section to reveal Interface Options. Select the interface that has been used to connect the oscilloscope to the computer, in this example USB.
The Instrument Control Toolbox permits the user to search for available hardware, configure instrument settings, read data from the instrument and save a log of the session as an M-file. To navigate the tool, click on the Help tab, which guides you through the process of connecting to the instrument. The Help section updates with specific steps that pertain to chosen options.
Under the driver that is selected, in Instrument Functions, select Read Waveform. For Waveform Object, select Waveform 1. For Input Argument(s), type in Channel 1. For Output argument(s), type in X,Y. Then show Help, if needed, and Execute.
The Response Window shows that the function has been completed successfully. Below, click on Export. The Data Exporter Window permits the user to select a destination, such as MATLAB Workspace. In the Command Window, enter plot (X, Y). The 5-V peak-to-peak square wave is now displayed in Matlab and shown in the computer.


Using the Matlab for a long time and I must say that it a lot of features and supports a lot of coding formats. Basically, it is all in one compiler