Power quality in the context of ac lines usually refers to how closely the ac line comes to approximating the ideal sinusoidal wave. Real-world factors such as electrical noise and the tolerance of ac voltage and frequency all affect power quality. Thus it is often important to measure the degree to which ac lines depart from the ideal sinusoid.
Perhaps the simplest way of determining power quality is to measure the ac mains voltage with two different kinds of voltmeters, one an averaging type of unit (such as an electromechanical movement meter), the other a true-RMS type of unit (such as a high-quality digital meter). Averaging- type meters are calibrated so their scales indicate RMS volts, assuming the measured ac voltage is sinusoidal.
However, if the ac voltage is a distorted sinewave, the averaging meter will not register the proper value, but the true-RMS meter always will, regardless of waveshape. So the greater the difference between the two meter readings, the worse the power quality, and the greater the harmonic content.
Unfortunately, the comparison of meter readings is somewhat of a blunt instrument as far as assessing power quality. When there are issues with power quality, it’s nice to have a way of isolating the source of the problem. That’s where an oscilloscope comes in, particularly a modern scope able to double as a spectrum analyzer.
First we’ll list some properties of electrical power as supplied by a utility and modified at the customer’s facility, which impact power quality:
• Unreliability – Frequent and/or prolonged outages. Utilities take the position that they will endeavor to maintain continuous service, but the fact is that at times there will be interruptions in power, most often due to violent weather events, equipment failure, or when intoxicated or texting drivers take out a power pole. Whatever the cause of a power loss, the utility is not generally liable for consequential damages unless negligence can be shown.
Regardless, depending upon the sensitivity of the load and reliability of the utility, end users generally feel the need to install robust backup generating capacity within the premises. Health-care facilities, where patients may be on life support and surgical procedures may be in progress, are required by electrical codes to maintain alternate power generation that comes online automatically within a few seconds upon failure of the main supply.
• Uniform voltage – Utility-supplied power in varying degrees conforms to nominal standards. For example, in the U.S., common single-phase residential service is rated at 120 and 240 nominal voltages. Other factors play a role as well, including size and length of the utility supply line and loading, which may vary with time of day and season.
If there is one concept utilities like, in addition to return-on-investment, it is diversity because this tends to keep measured voltage reasonably close to nominal voltage. The two are rarely exactly equal. For a 120-V circuit, 117 V is typically measured at the entrance panel. Premises wiring and loading can further reduce the measured voltage. Three percent and five percent reductions are common. Any greater voltage reduction will shorten the life expectancy of a motor, which is then converted from an engine of motion to a heating element. In general, electronic equipment that does not contain electric motors is not permanently damaged when it is operated at below-rated voltage, although in most cases, its performance is compromised.
• Frequency is defined as the number of complete cycles per second (Herz). It is the reciprocal of wavelength. Frequency is uniform at every point along the power line, unchanged by transformers. Frequency is critical in many applications, but most of the time the measured value does not deviate from nominal.
Most ac electrical power, other than from solar installations and fuel cells, is created by rotary generators. For central utilities, these are usually water- or steam-powered turbines. Generating facilities keep accurate records of their output. If frequency varies, they add or subtract a few cycles by regulating the speed of the prime mover. Frequency can be measured by means of a frequency counter, which is incorporated within modern oscilloscopes that have the Measure function. The user of an oscilloscope with an internal AFG can vary the output frequency over a wide range.
Line frequency determines RPM in synchronous motors. For this reason, these motors are often used to operate highly accurate clocks.

• Of great concern in power-quality measurements is the vast subject of harmonics. Harmonics may be seen in either voltage or current measurements of electrical energy in the distribution system. Harmonics are measurable amounts of power that resides in frequencies other than the fundamental, or intended nominal frequency. They are a frequent cause of electrical equipment malfunction and failure, so the task will be to identify and eliminate them.
Because harmonics are caused by non-linear electrical loads, they can generally be eliminated. In today’s electrical environment, non-linear loads are wide spread. Examples are fluorescent ballasts, rectifiers, non-constant-speed induction motors, and equipment such as computers and printers powered by switching supplies that lack power-factor correction.
When these and other non-linear loads are energized, they draw current that is non-sinusoidal. This non-sinusoidal nature gets reflected back through the supply circuitry so the entire system is affected. Harmonics can cause excessive heating in neutral conductors and the overheating of motors, which thrive on pure sinewaves. Correcting the problem can consist of identifying the load(s) causing the difficulty and disconnecting them.
As viewed on an oscilloscope, the current waveform containing harmonic distortion becomes increasingly complex depending on the amount of non-linear loading. Fourier series analysis tells us that any waveform can be decomposed into a series of simple sinewaves at the fundamental frequency and at integer multiples thereof. While the oscilloscope operating in the time domain shows the complex waveform, it is not possible to discover the harmonic relations by looking at this display.
Modern oscilloscopes, using the Fast Fourier Transform (FFT) that is part of the Math functions, can create a frequency-domain representation resembling a bar graph that shows the harmonic content. In the frequency domain, appearing when the user presses the correct soft key, the oscilloscope redefines the axes so the X-axis shows frequency (rather than the passage of time as in the time domain). The Y-axis still shows amplitude, but now as power on a logarithmic scale (as opposed to volts on a linear scale as in the time domain). The third-order whole integer multiple of the fundamental is known as the third harmonic. This is the one that causes so much trouble in three-phase Y-configured electrical systems.
Considering a three-phase system, each phase creates a harmonic, and these add in a constructive manner to create a single powerful harmonic.
Ordinarily, when the loading is resistive and therefore linear, the neutral currents in the three phases cancel. So, if the loads are balanced, there is no current in the neutral. This is one of the great advantages in a three-phase system. However, with non-linear loading, an oversize load is imposed on the neutral, straight back to the generator, which then must work harder to maintain the rated power output, much to the sorrow of the utility.
Thus one sign of problems is a non-zero current in the neutral line. If there is current in the neutral line of a three-phase system, at least one of the phases is carrying more current than the others.
Harmonics are repetitive waveforms that do not vary except abruptly as loads switch on and off line. They are in contrast to transients such as voltage spikes, which may happen at either random or regular intervals, depending upon their source. The oscilloscope is an excellent tool for displaying harmonics. When they happen briefly and rarely, it is possible to configure the instrument so it triggers exclusively on the harmonics and records the display in memory.
In addition to the oscilloscope, other measuring instruments are useful in performing power quality analysis. The digital clamp-on ammeter — perhaps one for each of the three phases — can be switched to the hold function and left in place overnight, over a weekend or for longer periods to acquire crucial information.

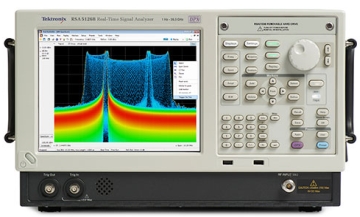
The spectrum analyzer displays waveforms in the frequency domain. While it is not as well-rounded and diverse in its functionality as the oscilloscope, it is capable of in-depth spectral analysis over an awesome range. Advanced labs and electronics shops have both instruments.

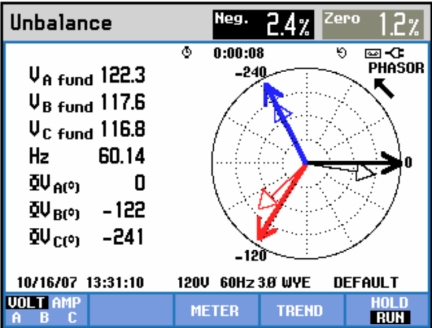
Power quality analyzers may be built into a generating facility or substation and they are also available as portable, hand-held instruments. They are capable of performing real-time analysis including measurement of voltage, current, frequency, dips or longer-range sags and changes of power factor, current unbalance and other anomalies. They are often paired with portable or fixed data loggers which gather and record long-range information over a period of days or weeks.
Power quality analysis may be performed on a new installation to acquire baseline data, or in the course of routine maintenance. There may also come a time when a facility experiences serious performance problems caused by power quality issues.
A good plan is to begin at the service entrance and isolate sub panels and branch circuits, temporarily disabling them if possible. It’s likely that powering down individual motors and other sources of harmonic distortion can provide an answer. If it is possible, another troubleshooting trick is to briefly shut down an entire facility or perhaps run it through a transfer switch on an alternate power source. This can be done to ascertain if the source of the power quality issue is internal or upstream in utility equipment.

I have three questions, all starting with a simple premise.
Suppose you were trying to measure the output of a power bank/ inverter. You know that the output is supposed to be a “pure sine wave”, but the actual output is affecting your electrical equipment in a way that convinces you that it is a modified sine wave.
You want to test the waveform.
1) If you are using a scope that has a 35V, +35V input range, is there any safe way to set the range so that you won’t fry the scope?
(For reference, this is the scope I’m speaking of: https://www.lab-nation.com/#specifications)
2) Would you touch the leads into hot and neutral? Or hot and ground?
3) Am I stupid to think that adding in a resistor would allow you to use a higher voltage on a scope that has a maximum voltage that is lower?
Hi John,
What I would do is get a step-down transformer with a 24-volt secondary of the type that is used with residential furnaces to run the thermostat circuit, available in a hardware store.. This will put you below your maximum oscilloscope input and the output will be isolated from ground, but check this all out with a multimeter, especially if you are using a used transformer, which could have an internal short that would affect the ground potential of the output. The waveform should not be affected.
Also, check your reading with various loads connected directly to the inverter, not the transformer.
David
I’d like to measure the power quality coming from various generators and UPSs. What kind of specs would you look for in an oscilloscope for testing 120V, 60Hz power? Looks like we want FFT functionality, and spectrum analysis would be a nice-to-have. What bandwidth is necessary to catching harmonics we’re concerned about?