In early analog oscilloscopes, users placed a transparent overlay, known as a graticule, over the screen and counted divisions to estimate waveform amplitudes at various points in time. In today’s digital storage oscilloscopes, the graticule is purely electronic, incorporated in the display. You can still count divisions to get a quick estimate, but the instrument’s substantial measurement capabilities can be invoked in on-screen menu choices.
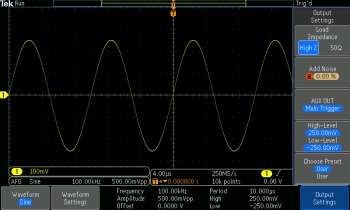
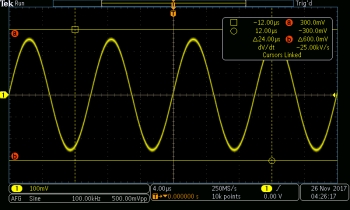
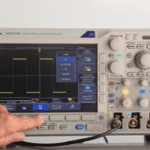
We’ll demonstrate this functionality in a Tektronix MDO 3000 series oscilloscope. First, via a BNC hookup, press AFG (arbitrary function generator) and in waveforms, select Sine. An information bar appears below the sine wave trace in the display and above the menu bar, which is linked to the horizontal row of soft keys. The information bar contains a limited amount of information. It displays the sine wave default frequency, 100 kHz, and the corresponding period, 10 μsec. The amplitude is 500 mV peak-to-peak, or 0.5 V. The offset is 0.000 V.
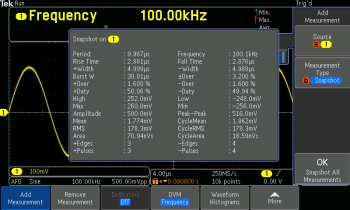
To see a more extensive array of measurements, in the Waveform Inspector section on the front panel, press Measure. Then press the soft key associated with Add Measurement. Make sure that Source, chosen by turning Multipurpose Knob a, is the channel input to which AFG is connected. (Default is Channel One.) Then, press OK Snapshot All Measurements.
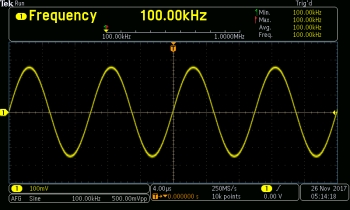
Next on the agenda, with Wave Inspector Measure still active, we’ll press DVM to open the Digital Voltmeter menu. The top menu item, Mode, simply, sets the meter to AC + DC RMS, DC, AC RMS and Frequency. Multipurpose Knob a is used. These are self-explanatory. AC + DC RMS reads 163.9 mV, as does AC RMS. For this signal, they are identical. DC volts fluctuates between 600 and 700 μV, essentially zero. We are seeing the noise floor of the instrument. Frequency is a precise 100.00 kHz.
DVM is similar to Snapshot All Measurements, but with far fewer categories. What is good about it is the bold, highly-readable display. Be sure the fourth menu item, Display Style, remains on Full, not Minimized. The next item in the Measure menu is Waveform Histograms. When the associated soft key is pressed, the Waveform Histograms menu comes up. The top menu item permits the user to toggle Histograms On and to choose between Vertical and Horizontal.
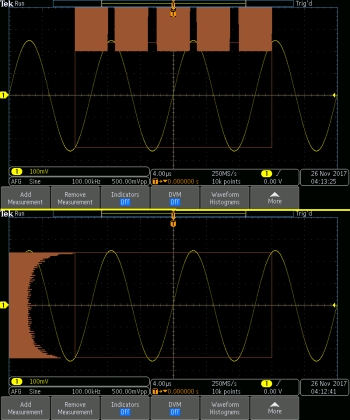
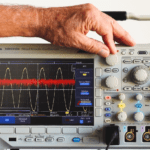
The Histogram is a bar graph with, by convention, no space between bars and all bars the same size. As you can see, in the vertical histogram, amplitude, positive and negative, on a horizontal scale relates to points in the time domain sine wave. (The conventional time wave representation and the Histogram display are two views of the same sine wave signal, or in the language of mathematics, function.)
Shifting to the horizontal histogram, again a bar graph with no space between equal sized bins, displays not amplitude as in the vertical histogram, but instead rate of change. These two histograms reinforce our knowledge of a fundamental sine wave characteristic, that rate of change has an inverse relation to amplitude.
It is interesting to look at vertical and horizontal histograms of other waveforms, such as Noise and DC. As waveforms change, it is necessary to press Autoset. Also, the Histogram won’t work unless you cycle through vertical and horizontal, essentially refreshing it.
Markers are useful in the frequency domain, especially at radio frequencies. To see how they work, first, in the front panel frequency section, press RF. You see in the display a frequency domain noise floor with no signal, or you might say with a 0-volt signal. This has nothing to do with the AFG waveform, which is currently connected to the Channel One analog input, not the RF input. Moreover, when RF is pressed, any analog channels that were On become deactivated. (RF and the two or four analog channels are mutually exclusive – not so the AFG.)
Because a signal is needed to demonstrate markers, shift the BNC cable that is connected to the AFG output on the back panel from the Channel One analog input to the RF input, using an RF adapter. With AFG On, in Waveform Settings increase the sine wave frequency to its maximum, which is 50 MHz. Notice the prominent spike at the left of the display, which is the fundamental. There are no harmonics in this pure sine wave. To make the display more readable, we want to shift the fundamental to the center of the screen. To do this, press Freq/Span and set Center Frequency to 50 MHz, the same as the sine wave setting in the AFG. Set Span to twice that amount, 100 MHz. Notice that Start and Stop set themselves. Now we have a good frequency domain display. Change the AFG output to square wave so that we have some harmonic peaks.
In the RF section, press Markers and in the vertical menu bar, turn Markers On. Notice that markers, inverted triangle icons, now appear at each peak. Multipurpose Knob a sets the number of markers, up to a maximum of 11. Each marker is labeled with its frequency location and amplitude level in decibels.
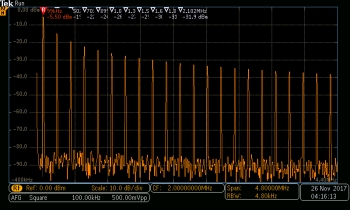
Manual markers permit the user to measure non-peak areas in the spectrum. They are shifted using Multipurpose Knobs a and b.
The last choice in the Markers Menu is Readout, which may be Absolute or Delta. The latter is relative to the Reference Marker, and appears at the Marker icons, pertaining to frequency and amplitude in decibels.
Cursors are pairs of lines, vertical or horizontal, that define the portion of a waveform that is measured. The user selects amplitude or frequency related cursors and manually moves them to display measurements on an acquired waveform. To turn them on, push Cursors at the top of the front panel A second push toggles them off. To display the cursor menu, push and hold the Cursor button. As you turn Multipurpose Knob a, one of the cursors moves to the left or right. Multipurpose Knob b moves the other cursor.
With cursors on, press the Select button, located between Multipurpose Knobs a and b. This links the cursors so that both move when Multipurpose Knob a is turned. Pushing Select a second time unlinks the cursors. In the Cursors menu item, Waveform or Screen can be selected. When Waveform is selected, there is one pair of vertical cursors. When Screen is selected, a second, horizontal pair of cursors appears. The Bars menu item chooses which pair of cursors, denoted by the solid lines, is active. The vertical lines on the display read horizontal parameters, such as time. The horizontal lines on the display read vertical parameters, such as voltage.


Hello…i have a problem…i sent signal via LED bandwidth so that its value is real and positive. I can see these signal in RTO MDO3000 perfectly but when i save them as .csv file, the dots of negative values were missing…i only got positive values only. Please suggest me something to solve this. Thanks in advance!