Impedance analyzers work better than LCR meters when it comes to sizing up the super-low impedance and inductance of modern power converter capacitors.
Tim Ashworth, Meng Li, Zurich Instruments
DC-link capacitors are often found in power conversion applications such as inverters, motor drives, medical power supply equipment, and so forth. Consequently, dc-link capacitors often need a high capacitance with high dielectric strength. From an energy-saving perspective, they should also exhibit a low dissipation factor (equivalently, a low equivalent series resistance, ESR).
More importantly, dc-link capacitors quickly stabilize the dc voltage. A low equivalent series inductance (ESL) is critical for this role. Thus, design engineers must accurately understand ESR and ESL and how to accurately measure them in dc-link capacitors.
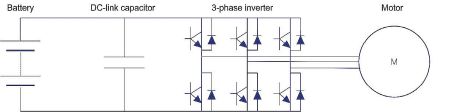
Consider a typical drive system on an electric vehicle. It includes a rechargeable bank of batteries, a three-phase inverter, and an electric traction motor. The battery bank can output a voltage as high as 800 Vdc and control the power delivery using power transistors (IGBTs or power MOSFETs) that switch in the kilohertz frequency range. A dc-link capacitor sits between the dc power source and the switching circuit. It is designed to provide a stable dc voltage by minimizing the voltage ripple that the inverter sporadically demands.
The electrical response of any “ideal” capacitor is purely capacitive with a phase angle of -90°. But a real-world device also has parasitic inductance and resistance. For an easy understanding, we can visualize an ESR and an ESL in series with the capacitor. The ESR is a lumped parameter representation of the dielectric loss, and the ESL corresponds to the inductance. ESL generally arises from the leads connected to the capacitor as well as from the construction (e.g., winding) of the capacitor itself. It is important to note that even with three equivalent elements, this model can sometimes be too simple. As a result, the ESR and the ESL may not stay constant over frequency.
The ESR and the ESL of a dc-link capacitor (and its connectors) play a significant role in the aforementioned EV drive system. The ESR causes power dissipation and generates heat, leading to overheating problems. On the other hand, the ESL stores inductive energy. When the motor drive transistor switches off, the resulting transient can cause voltage overshoot.
Thanks to technological advances in manufacturing, dc-link capacitor ESL can be reduced to the nanohenry level and ESR to less than 1 mΩ. But designers will want to confirm the values on the spec sheet with accurate measurements to ensure the capacitor can meet safety requirements with enough margin.
LCR meters and impedance analyzers
Both LCR meters and impedance analyzers can characterize dc-link capacitors. Both instruments measure impedance based on Ohm’s law by taking a ratio of phase-sensitive voltage to current. The ratio gives the absolute impedance and phase from which the real and the imaginary impedance can be calculated. Parameters such as capacitance, inductance, resistance, quality (Q) factor, and its reciprocal (dissipation factor, DF) are subsequently derived from the complex impedance. They are derived by applying a proper equivalent-circuit model on the measured impedance. LCR meters and impedance analyzers often include several built-in models to extract these parameters.
Nevertheless, the two instruments are different: An LCR meter primarily measures impedance at a fixed frequency, whereas an impedance analyzer–such as the Zurich Instruments MFIA Impedance Analyzer–can measure impedance as a function of frequency. An impedance analyzer is generally more desirable as neither the ESR nor the ESL of a dc-link capacitor are constant, and we want to study their frequency dependence.
The MFIA provides the LCR function while also being able to sweep frequency and graphically display the acquired impedance parameters. To measure the ESR and the ESL, we mainly use two tools provided in Zurich Instruments software called LabOne: the sweeper and the compensation advisor. The sweeper allows sweeping parameters of interest (such as frequency) in a freely adjustable number of steps. The compensation advisor promotes accurate and reproducible measurement results via a step-by-step guide to eliminate parasitic impedance from the test fixture or cabling.
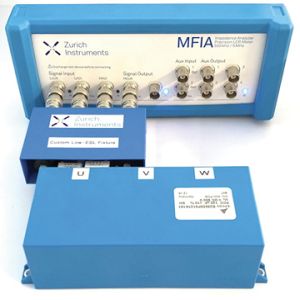
As an example, consider a device-under-test (DUT) capacitor from TDK having a nominal capacitance of 120 µF, an ESR of 0.8 mΩ, and an ESL of <15 nH. We might connect the DUT to the instrument’s front panel via a custom fixture. The fixture features flexible connectors to allow for the vertical offset of the dc-link busbar connectors, which match the IGBT module design from the manufacturer. The other end of the fixture uses four BNC connectors in standard 22-mm spacing.
The first step in accurately measuring the impedance of a dc-link capacitor consists of running a compensation routine that allows for the impedance of the fixture in the actual measured data. In this example, we can run a load-short routine from 1 kHz to 5 MHz. This procedure allows us to redefine the measurement plane to be at the connectors of the fixture, which directly touch the capacitor.
Next, we can again measure the short to get an idea of the measurement baseline. The resulting ESR and ESL of the short can be separately displayed in two sweeper windows. In this example, these sweeps confirm a low baseline of 15.7 µΩ and 1.7 pH for the ESR and the ESL, respectively. Such low values give us the confidence that we can, subsequently, reliably measure the capacitor.
Getting an overview
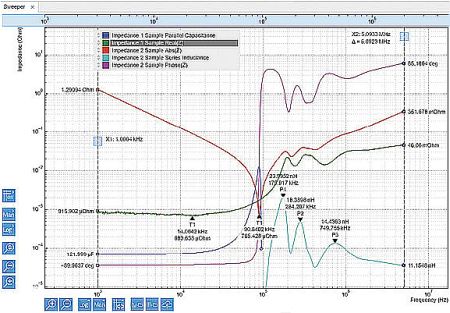
The next step is to measure the dc-link capacitor over the full frequency range of interest. The result is illustrated in the nearby screenshot with a multi-trace
sweep from 1 kHz to 5 MHz. One trace shows the real part of the impedance and is equivalent to ESR. At the lowest frequency of 1 kHz, the capacitance is read as 121.999 µF, which is consistent with the specified value of 120 uF ±10%. Above 90.8 kHz–the self-resonance frequency (SRF) of the capacitor–the ESL is plotted and shows three peaks annotated at 175.9 kHz, 284.2 kHz, and 749.7 kHz. In addition to the ESR and the ESL, traces show absolute impedance and phase. This panoramic view helps understand the capacitor’s behavior at different frequencies so we can more reliably predict its response in real-world applications.
Thus, we conclude that the ESR should be measured at low frequency, whereas the ESL should be measured at higher frequency. We can then simply repeat the first step by opening two different sweeper windows to cover two ranges: 1 kHz to 100 kHz and 100 kHz to 5 MHz.
As the dc-link capacitor in this example has three different sets of electrodes, each electrode set is measured sequentially and repeated five times to demonstrate the repeatability of the measurements. The test signal amplitude is set to 900 mV. Under default settings, a sweep of 200 frequency points lasts around 12 sec.
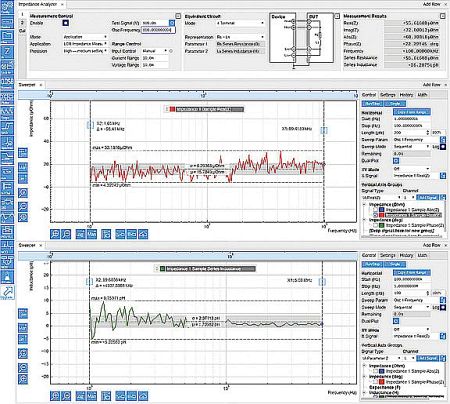
The upper window of the nearby screenshot shows a sweep of real(Z) corresponding to the ESR. In total, there are fifteen traces in the sweeper, color-coded to the electrode set. The traces overlap to a high degree thanks to the excellent repeatability of the measurement even after disconnecting and reconnecting. The ESR measured using the electrodes W (blue traces) can be read from the black arrow showing 718 µΩ at 11.35 kHz. This nicely agrees and confirms the stated value of ESR at 0.8 mΩ. The yellow trace in the sweeper corresponds to a short measurement as our baseline.
The nearby screenshot shows the ESL from 100 kHz to 5 MHz in the lower sweeper window. Traces are color-coded to match the three sets of electrodes, and traces
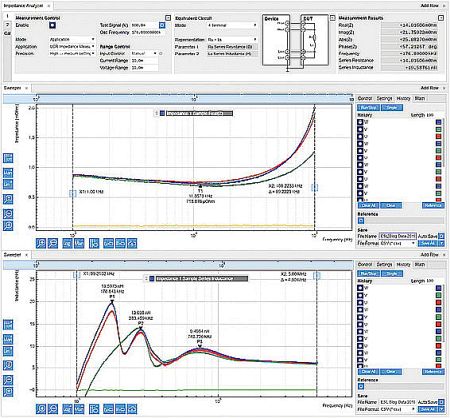
overlap because measurements are repeatable to a high degree. A light-green trace corresponds to a short measurement as the baseline in ESL and is much lower than the three electrode sets. Electrodes U and W are geometrically symmetric and show a similar behavior with three peaks at approximately 176 kHz, 283 kHz, and 742 kHz. The center set of electrodes, U, in contrast, has only two peaks in ESL. The lowest peak value of ESL from the blue traces is 9.49 nH at 742 kHz. This is again in a nice agreement with the stated value of <15 nH.
Thus the ESR and the ESL of a dc-link capacitor can be accurately and repeatably measured using an impedance analyzer. After carefully compensating for the parasitic impedance of the test fixture, the measurement plane can be reset from the instrument’s front panel to the DUT’s position.
In this case, measurement baselines of both ESR and ESL are significantly lowered, to 15.7 µΩ and 1.7 pH, respectively. This leaves a lot of headroom for future measurements as manufacturers continue to improve both ESR and/or ESL. In addition, the impedance analysis shows the variation of ESR and ESL as a function of frequency. The measurement not only confirms the specified values by the manufacturers but also enables a detailed study of the DUT with circuit modeling.


Leave a Reply
You must be logged in to post a comment.