Passive electronic filters are composed of one or more passive components including resistors, inductors and capacitors. In contrast, active electronic filters also contain an amplifier composed of transistors or op-amps. The point of electronic filters is to pass some frequencies while blocking others. Depending upon the configuration, they selectively attenuate high frequencies (low pass), low frequencies (high pass) or both (band pass).
Electronic filters are often implemented to separate and ultimately discard unwanted noise from a signal of interest. By far the most-used filter is low-pass. Blocking frequencies that are higher than the relevant portion of the spectrum has several advantages.
Another concern is to eliminate aliasing. Nyquist informs us that an analog signal can be accurately represented provided that the original signal’s highest frequency component, including harmonics, is less than half the sampling frequency. A low-pass filter, accordingly, can stop the wagon wheel from turning backwards as well as eliminating irrelevant Moiré patterns. Aliasing is implicated in the sampling process.
The only way to correct it, aside from increasing the sampling rate, is to filter out high frequency material upstream of the digitizer.
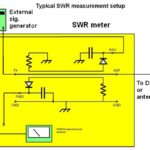
The characterization of filter qualities usually involves measuring the amplitude of the filter output as a function of frequency. The measurement of filter amplitude output is generally straightforward–apply a sweeping signal generator at the filter input and to the sweep input of an oscilloscope of sufficient bandwidth while monitoring filter output on a scope channel. Alternatively, vector network analyzers are designed to measure filter pass bands more automatically.
However, there is another aspect of filter performance that can be important, particularly for frequencies in the gigahertz range and higher: Phase shift, the time interval between the filter’s input and output, can change depending on the signal frequency at the input. In applications where it is necessary to preserve the original waveforms while discarding high-frequency noise, phase shift should be suppressed.

Phase shift measurement is simple for single frequencies. In the low-pass case, the output of the filter lags the input (negative phase shift); in the high-pass case the output leads the input (positive phase shift). It is relatively straightforward to measure the shift for a single frequency: Display both the filter input and output waveforms on a scope, then use cursors to match up waveform points. The difference in cursor position represents the phase shift.
For the single-pole low-pass case, the transfer function has a phase shift given by φ(ω)=-tan-1 (ω/ω0) where ω represents a radian frequency (ω = 2πf radians/sec; 1 Hz = 2π radians/sec) and ω0 denotes the radian center frequency of the filter. The center frequency will be the frequency at which the phase shift is at 50% of its range. (The radian frequency is used in a ratio, so the frequency ratio, f/f0, can be substituted for ω/ω0).
Because a single-pole low-pass has a 90° range of phase shift—from 0° to 90°—the center frequency has a phase shift of –45°. In graphs of phase shift, it is usual practice to express ω = ω0 as the normalized center frequency equal to 1.
One useful fact when working with phase delay is that EM radiation travels about one foot in one nanosecond in free space (the exact value is 0.983571 ft/nsec). The speed of light is exactly equal to 1/(εμ)0.5, where ε is the permittivity of the medium and μ is its permeability. In ordinary coax cable, for example, the practice is to use 100% PTFE filling which has a dielectric constant of about 2.2. This produces a delay of 1.45 nsec/ft in solid PTFE coax.
Phase delay becomes more complicated when there are multiple frequencies propagating through the filter. The presence of multiple frequencies brings up the concept of group delay. Group delay is defined as the rate-of-change of transmission phase angle with respect to frequency. This is about as clear as mud. In usual way of explaining group delay starts with the fact that in real-life electronic filters, different frequencies pass through the filter with different phase delays. The group delay describes how much phase delay takes place for each of the frequencies that the filter passes.

In general, filters designed to provide a flat passband amplitude don’t provide a flat group delay across the band of frequencies they pass. (The group delay response outside the passband is usually of no consequence and may not be easily measurable.) But some filters are designed specifically to realize a flat group delay. An example is the Bessel-Thompson filter which does so at the expense of some passband ripple and less-steep skirts.
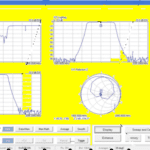
Though it is possible to measure filter group delay with ordinary oscilloscopes, the measurement process is quite involved. Additionally, group delay is of most interest at microwave frequencies and higher. Scopes with the necessary bandwidth can be pricey. So the usual means of gauging group delay is via vector network analyzers.
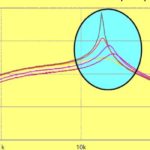
VNAs have several operating parameters that come into play when measuring group delay. One example is that of their aperture setting. Aperture in a VNA is somewhat analogous to the video bandwidth in a spectrum analyzer. Just as the video bandwidth determines the capability of the analyzer to discriminate between two different frequencies that are relatively close together, the frequency interval (Δf) between the two phase measurement points is called the aperture. A narrow aperture provides more detail in phase linearity but makes measurements more susceptible to noise (smaller signal-to-noise ratio) and phase detector resolution. A wider aperture provides less detail in phase linearity because some phase response gets averaged-out or not measured, though the measurement is less susceptible to noise.
Consequently, changing the aperture can result in different values of group delay. The computed slope (-Δφ/Δf) varies with the aperture. This is why the aperture used to make the measurements must be known when comparing group delay data.
Finally, filters are subject to the same effects as other circuits containing energy storage components. They have a settling time, ringing due to abrupt voltage changes at the input, and a dc offset, which shifts the output above or below the X-axis. Temperature is often the culprit. And of course, all circuits produce some amount of noise.

Leave a Reply
You must be logged in to post a comment.