Feedback is relevant not only to electronic circuits but also to all kinds of natural and human-based phenomena ranging from mechanical engineering to economics and finance. Feedback emerges when one or more system outputs are connected back to system inputs. If polarity is inverted, it is an instance of negative feedback, which in electrical circuits may be implemented to reduce excessive gain, thereby increasing stability.
Ancient Egyptian engineers employed feedback to regulate the flow of water. A low water level opens a float valve and high water closes it. Similarly, a thermostat or pressure switch exhibits hysteresis in regulating a heat system or air compressor. As steam engines were adapted to provide circular motion, they were equipped with centrifugal governors to control RPM and torque.
We usually think of James Clerk Maxwell (1831-1879) in the context of his electrodynamic equations. But he also authored On Governors (1868) which lays the basis for modern control theory. In Maxwell’s characteristic manner, he totally rationalizes the central concept, which is feedback.
The example used to explain feedback in electronics texts generally employs an op amp. For stability, the op-amp in most examples is used as an inverting amplifier with negative feedback, the amount of which is generally regulated by two resistors configured as a voltage divider. The amplifier’s gain is determined by the external components with little regard to the op-amp’s internal qualities.
For educational purposes, electronics texts discuss what goes on at the various nodes inside the feedback loop. In the real world, however, it may be tough to actually measure feedback parameters such as stability, loop, gain, or phase margin. Fortunately, there are techniques for analyzing feedback circuit behavior by simply stimulating the circuit while recording what happens on specialized test instrumentation.
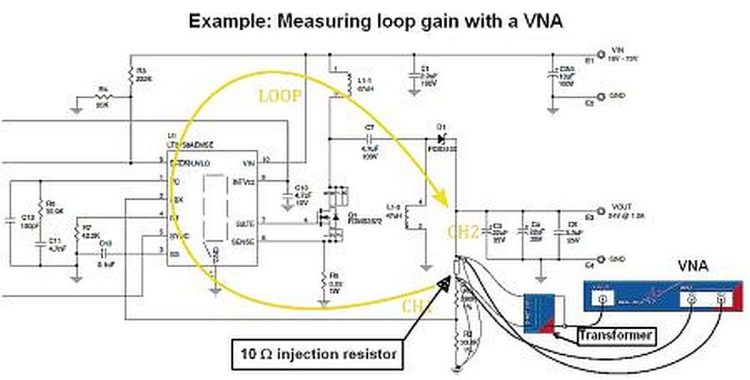
The instrumentation required is a vector network analyzer (VNA). One technique is to break the feedback loop and insert a signal that sweeps through frequencies that perturb the circuit operation slightly. Then the VNA records the results.

load-currents. In the frequency range from 10 kHz to 30 kHz, the output impedance peaks depending
on the phase margin of the control loop.
Such techniques are often used to analyze the stability (gain/phase) of linear, switching, and point-of-load regulators. Designers can also evaluate stability by measuring the device’s output impedance. One way to get the bandwidth and phase margin involves analyzing the impedance’s group delay. Group delay is the rate-of-change of phase with respect to frequency. In regulator analysis, the phase is the offset between two signals: the changes in the load current and the resulting voltage response of the regulator. A peak in the group delay marks a point of rapid phase change.
There are two principal sources of rapid phase changes: A resonance, either from an LC filter or the self-resonance of an inductor or capacitor; and the zero-crossing point of a system’s loop gain.
Each peak in the group delay represents either a passive resonance or low-phase-margin gain crossover. When the load current changes, the peaks can cause voltage oscillation at the resonance frequencies. High-Q peaks are more likely to provoke oscillation. The variations in a regulator’s output impedance can provide data to calculate the system phase margin, and by implication, its stability.
To measure output impedance, you basically need a VNA that plots group delay (an example is the Omicron Lab Bode 100), a current injector to perturb the output, and a 1:1 voltage probe. The probe and the current injector go on the regulator’s output. A signal from the VNA modulates the current injector’s output. The injector’s monitor output delivers a voltage proportional to the current flowing through the injector. The VNA measures this signal on one of its inputs and measures the output voltage on the other through the probe. The ratio (CH2/CH1) of the ac output voltage to the ac injected current is the output impedance which is plotted versus frequency.
Software on this particular VNA (that is, the Lab Bode 100) can calculate the Q and phase margin from the group delay. This measurement technique can also be used to assess the stability of filters, linear regulators, switching regulators, op amps, and other circuitry.
A related technique is to insert a small resistance in the feedback loop of the circuit and couple a small signal across it. This works for situations where it’s practical to make electrical connections to the loop (as on, say, demo boards).

Leave a Reply
You must be logged in to post a comment.