The precision and accuracy of voltage measurements made with a digital scope are affected by the speed at which samples are taken, i.e. the sampling rate, and sampling depth or bit depth. Bit depth is just the number of bits of information in each sample, and it directly corresponds to the resolution of each sample. It also relates to the dynamic range of the system, the largest and smallest amplitude signal that can be digitized.
The other side of the coin is distortion. A 16-bit quantization of a signal, for example, implies 96 dB dynamic range and 0.0015% minimum distortion. It is worth exploring where these figures come from. They generally can’t be found on the scope spec sheet but are instead calculated from fundamental principles.
 In digital systems, dynamic range is the ratio of maximum and minimum signal levels required to maintain a specified bit error ratio. The number of bit errors is the number of received bits of a data stream over a communication channel that have been altered due to noise, interference, distortion or bit synchronization errors. The bit error rate (BER) is the number of bit errors per unit time. The bit error ratio (also BER) is the number of bit errors divided by the total number of transferred bits during a time interval of interest. Bit error ratio is a unitless performance measure, often expressed as a percentage.
Another way of looking at the dynamic range is as the ratio of the maximum voltage to the minimum voltage that the ADC can convert. In general, the dynamic range is only a function of the number of bits, not the maximum input voltage. The dynamic range is the ratio (usually expressed in dB) between the noise floor of the ADC and the maximum input. A 12-bit converter, for example, has a resolution of 212 – 1 or 4,095. If we were digitizing a 5-V signal with a 12-bit converter, the minimum voltage for which the ADC would have only the least significant bit set, is 5/4,095 = 1.22 mV. So the dynamic range of the ADC in this case is 20 × log10(5/0.00122) = 72.2 dB.
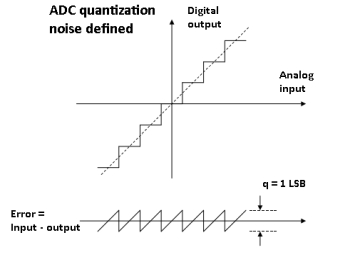
The quantization noise sets a lower limit on the noise floor at the actual sample rate. Quantization noise is just the error introduced by quantization in the ADC. It is basically a rounding error between the analog input voltage to the ADC and the output digitized value. However, the noise of a real ADC will be higher than the quantization noise.
There is another widely used equation for the signal-to-noise ratio of an ADC: SNR = 6.021×N + 1.763 dB where N = is the number of bits. It is worth delving into how this equation arises.
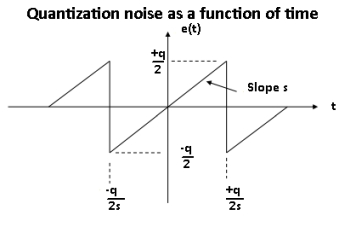
The full derivation of this equation gets rather involved. A short-form version begins with the quantization error of the ADC. An ideal converter digitizes a signal with a maximum error equal to ±½ least significant bit, LSB. The quantization error for any ac signal which spans more than a few LSBs can be approximated by a sawtooth waveform having a peak-to-peak amplitude of q, the weight of an LSB. There are some simplifying assumptions in this analysis, but they aren’t important for explaining the dynamic range equation.
The analysis starts with an equation e(t) for the sawtooth error written in terms of the slope of the sawtooth, s, as depicted in the figure above :
e(t) = st, -q/2s < t < +q/2s
We then calculate the mean-square value of this error term. The mean-square error measures the average of the squares of the errors or deviations — that is, the difference between the error estimation and what is estimated. In the case of the sawtooth error, we do this by squaring each individual sawtooth, represented by st, and summing and dividing by the number of samples. This operation can be written as an integral:

We get a root-mean-square quantization error by taking the square root of q2/12 :

Remember that the Nyquist bandwidth runs from dc to half the sampling frequency. The quantization noise spreads more or less uniformly over the Nyquist bandwidth. One underlying assumption is that the quantization noise is uncorrelated to the input signal. Under special conditions where the sampling clock and the signal are harmonically related, the quantization noise becomes correlated, and the energy is concentrated in the harmonics of the signal being digitized. But the rms value of the noise remains approximately q/√12.
The theoretical signal-to-noise ratio can now be calculated assuming a full-scale input sine wave v(t):

From the relationship Vrms = Vpeak/√2, the rms value Vrms of the full-scale input is

The rms signal-to-noise ratio for an ideal N-bit converter is therefore
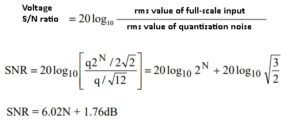
This relationship holds over the Nyquist bandwidth, from dc to half the sampling frequency.
There are certain special conditions where noise frequencies may be highly correlated to the ac-input signal. For instance, there is a greater correlation between noise and inputs for low-amplitude periodic signals than for large-amplitude random signals. The usual assumption is that the theoretical quantization noise is uniform all the way to the Nyquist frequency. But in the case of strong correlation, the quantization noise appears concentrated at the various harmonics of the input signal, just where they’re not wanted.
In most cases, the input to the ADC is a band of frequencies (always summed with some unavoidable system noise), so the quantization noise tends to be random. In performing FFTs on ADCs using spectrally pure sinewaves as inputs, however, the correlation between the quantization noise and the signal depends upon the ratio of the sampling frequency to the input signal.
There are several ADC types. Generally, oscilloscope specs don’t go into the type of ADC the scope uses.
• Flash or parallel, in which the analog signal to be sampled is compared to an array of reference voltages.
• Successive approximation, in which provisional binary codes are back-connected to analog voltages and compared to the analog signal at the input, to see which of these constitutes the best match.
• Voltage-to-frequency, in which a digital pulse signal is generated, whose frequency varies with the analog voltage at the device input.
• Single-slope integration, in which a capacitor is charged to the analog voltage at the ADC input and the time for this charge to be completed is measured and gated so as to acquire a digital value.
• Dual-slope integration, in which the procedure resembles single-slope integration, the difference being that in addition to measuring the time for a capacitor to charge, measurements are taken of its discharge time and comparisons are made in the interest of achieving greater accuracy.
• Delta-sigma, in which the analog input voltage is converted by a modulator to a serial bitstream, which passes through a lowpass filter to create the digital output. Modulators function in various ways, adding to the complexity of delta-sigma. However, delta-sigma is very widely used in many ADC applications.
In most digital storage oscilloscopes, the sample acquisition mode is defaulted when the instrument is powered up. One sample is sent to memory during each sampling interval, and all other samples are discarded. This sampling mode, known a decimation, has a potential drawback, which is that important samples may not be saved.
An alternative sampling mode, known as peak detect, saves highest and lowest peaks from adjacent waveforms, preserving them in the waveform memory, so high and low values including glitches are retained.
Additional acquisition modes, average and envelope, together with peak detect and sample acquisition, are displayed and recorded for future use if desired. Because this information is likely to overwhelm the display graticule, the oscilloscope is obliged to compress the samples. The resulting sample density displays as a range of color intensities, permitting the user to observe waveform shape, noise and uncertainty in a single display.
When zoomed in, the instrument displays fewer overlapping points so that the samples are realistically displayed in each pixel column. Eventually, the waveform line is interpolated either using linear interpolation or a sin(x)/x method that can be particularly accurate for representing sinusoids.
In the processor, both displayed waveforms and waveform records are created. These automatic procedures affect the appearance in the display of the waveform being studied and also they affect measurements that are made on the waveform record.
In the Tektronix MDO 3000 and 4000 instruments, among others, a Waveform Inspector function consisting of concentric zoom and pan knobs and buttons that include a Measure function, can provide a gateway into the interesting world of post-analog-to-digital-conversion processing.

Leave a Reply
You must be logged in to post a comment.