Today, an advanced multimeter such as the Fluke 287 in volts mode accurately displays frequency. High frequencies are displayed in a bench-type frequency counter, which can read above 100 GHz. At still higher frequencies, measurements are made indirectly via heterodyning to down-convert the signal. Using a diode or similar device as a mixer, a frequency counter can measure the resultant provided the two frequencies are sufficiently close. For the highest frequencies, several stages of heterodyning are needed.
Heterodyning, which implies more than one frequency, is used also in one method of optical detection, where information encoded in phase or frequency is extracted. Two light signals are combined in a photodiode or other detector. The energy response is linear while electromagnetic amplitude is quadratic. The detector produces a beat frequency that can be electronically processed provided the original light frequencies are close enough.
Optical heterodyne detection commenced following the construction of the first workable laser in 1960. Optical band detection differs with respect to radio frequency heterodyne detection because light oscillates much too fast to measure or process electronically. Because photons are detected by having their energy absorbed, magnitude but not electric field phase is revealed. Optical heterodyning is accordingly used to lower the signal out of the light band of the frequency spectrum.
Of course, there are other ways of determining frequency of light in the visible or UV range besides heterodyning. There are a couple of simple ways worth mentioning that are also the subject of several YouTube videos. Perhaps the most straightforward method works for lasers emitting visible light as from laser pointers.
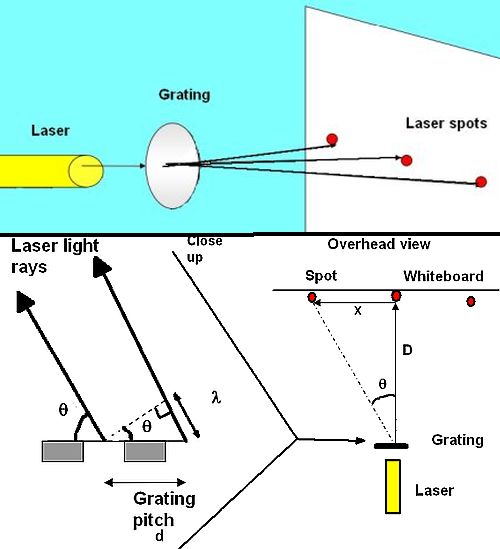
The simple method for determining the light frequency of a laser pointer is to send the laser light through a diffraction grating and onto a flat surface such as a whiteboard. The diffraction grating will split the laser light into three beams–a main beam and one on either side–visible on the white board. Measuring the distance between the main and side beam, and knowing the distance from the grating to the whiteboard and the distance between grating ridges (i.e. the grating pitch), allows a calculation of the light wavelength.
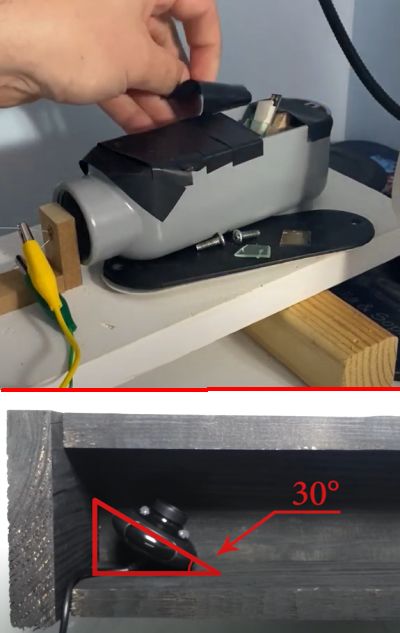
This is basically a no-cost experiment because the grating is usually on old DVD or CD that has been repurposed. CDs are repurposed by removing their reflective layer, usually with sticky tape. DVDs are repurposed by splitting the reflective layer from the backing (usually with a razor blade) and then employing sticky tape to take off the reflective layer. The key point to note about repurposed CDs and DVDs is their track pitch: 1.6 μm for a CD, 0.74 μm for DVDs.
When a laser shines through the grating, the distance between the main beam on the white board and the two side beams is determined by the grating track pitch. The distance from the grating to the main laser spot and the distance from the main spot to one of the secondary spots forms a right-triangle having an angle of diffraction at the surface of the grating. Taking a closer look at the grating surface, another right-triangle forms with the hypotenuse represented by the distance between two grating openings, and the angle of diffraction. The distance between the main beam and side beam is also a function of the laser light wavelength. The reason: One beam must travel further than the other to form the side spot; the additional distance equals one wavelength. This relationship gives rise to the equation sine θ = λ/d, where d is the grating pitch. We can figure out the angle of diffraction from the spot, x, and whiteboard, D, distances from tan θ = x/D. Solving this equation for θ and then substituting the value of θ into θ = λ/d allows solving for the laser wavelength λ.
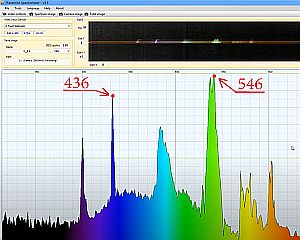
This technique works well when there is only one wavelength involved as with laser light. Non-coherent light sources put through a grating this way will produce color bands on each side of the main spot as the grating separates the light wavelengths. So it becomes a bit clumsy to measure all the distances and angles involved. A simpler way of determining light wavelength is with a spectrometer.
Though spectrometers were once expensive bench instruments, spectrometer software for PCs has brought them within reach of even hobbyists. The usual sensor is a web cam with its IR filter removed. Sitting in front of the camera lens is a make-shift CD or DVR grating and a slit opening sitting. Often the most complicated part of the setup lies in devising the fixture for the webcam, grating, and optical slit. Here too, several YouTube videos cover the steps involved.

Leave a Reply
You must be logged in to post a comment.