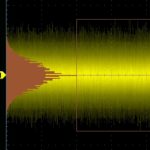
Histograms are used to display graphically continuous variables. They are relevant in many areas including digital photography, census data, actuarial statistics and, as we shall see, signal measurements in an oscilloscope. In digital photography, an image histogram is a graphical representation of the tonal distribution. The graph depicts the number of pixels for each tonal […]

