At first glance, impedance analyzers and network analyzers seem to do the same thing: Describe the impedance of whatever is connected to their inputs. This statement is true as far as it goes, but as you might expect, there are significant differences between the two types of instruments. Here’s a review of the basics.

There are a handful of different measurement principles used to create impedance analyzers. The factor that generally determines the measurement method used is the frequency range of interest. As wireless technologies have proliferated, the frequencies of most general interest these days tend to be in the low gigahertz range and up. With that in mind, we’ll cover the RF I-V method often used in impedance analyzers designed for that frequency range. (Impedance analyzers limited to lower frequencies may employ less exotic methods such as an ordinary balanced bridge or resonant circuit.)

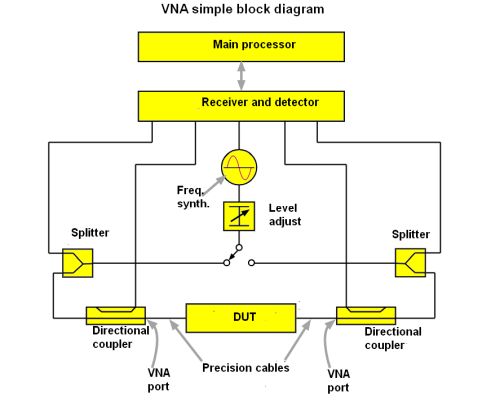
The usual way of determining Zx is to use one sense resistor for Zx current, another for Zx voltage with a V/I multiplexor switching the measurement circuit between the two. A frequency synthesizer feeds a signal into the measurement circuit which is swept across the frequency range of interest. A V/I multiplexor alternatively feeds Zx current-sense-resistor and voltage readings to an a/d converter. The V/I input multiplexer alternately selects the DUT voltage and resistor voltage representing the DUT current (call it VC) and the two vector voltages are measured with an identical vector ratio detector to avoid tracking errors. The ratio of the two voltages provide the impedance of the DUT as Zx = 50 × (EVdut/VC.)
Because the measurement frequencies can get into the gigahertz range, the resulting outputs can be in the same range. So to get the outputs down to a frequency range that is easier for the a/d converter to handle, there is usually a down-conversion stage before the voltage gets to a/d conversion.
 Now consider the principle of operation for a vector network analyzer, VNA. The network analysis method measures the reflection coefficient value (Γx) of the DUT rather than the impedance directly. Γx is correlated with impedance, by Γx = (Zx – Zo)/(Zx + Zo) where Zo is the characteristic impedance of the measurement circuit (50 Ω) and Zx is the DUT impedance. In accordance with this equation, measured reflection coefficient varies from –1 to 1 depending on the impedance (Zx.)
Perhaps the main thing to note about a VNA is the presence of both an output port and an input port, and some VNAs have multiple output and input ports. There are three principal kinds of measurements that VNAs handle: phase delay, group delay, and S parameter characterization. Phase delay measures the time it takes for a sinusoid of a given frequency to get through the DUT. Group delay is defined mathematically as the derivative of phase delay. The physical manifestation of group delay is a bit harder to grasp.
The usual explanation of group delay uses the example of an amplitude-modulated sine wave. Group delay specifies the degree to which the amplitude envelope will be delayed as it traverses the DUT. Another way to visualize group delay is to recall that amplitude modulation introduces sideband frequencies on either side of the carrier frequency. Group delay can be thought of as information about how the sidebands will be delayed relative to the carrier frequency. The delay will change the shape of the amplitude envelope.
Usually, both phase delay and group delay measurements on a VNA involve a single button push once the test setup has gone through a calibration and the DUT is connected.
That brings us to S parameters. As a quick review, S-parameters describe how an N-port network responds to signals applied at any or all of the ports. The first number in the subscript refers to the responding port, while the second number refers to the incident port. So S21 refers to the response at port two due to a signal at port one. In circuit work, the most common S parameters are for two-port networks. Also, the S parameters of most interest are generally the input and output reflection coefficients S11 and S22. These are typically plotted on the Smith chart. Transmission coefficients (S21 and S12) are usually not.
The VNA determines S11 and S21 by measuring the magnitude and phase of the incident, reflected, and transmitted voltage signals when the output is terminated in a load that equals the characteristic impedance of the DUT. This condition guarantees there are no reflections from the load. S11 is equivalent to the input complex reflection coefficient or impedance of the DUT, and S21 is the forward complex transmission coefficient. Likewise, by placing the source at port two and terminating port one in a perfect load makes sure there are no reflections from the input. Then S22 and S12 measurements can be made.
VNAs measure the scattering parameters between ports in a multi-port network. These could mathematically be converted to impedance parameters, but this will necessarily include transfer impedances as well as the input port impedances. On the other hand, an impedance analyzer emphasizes the accurate measurement of complex impedance between a pair of terminals. When the system under test comprises only one port, there’s probably little difference in VNA and impedance analyzer measurements though the methodology is different. That said, there can be scenarios involving a high impedance where a VNA will give an accurate reflection coefficient close to one but the impedance calculated from this value could be a off significantly. In contrast, an impedance analyzer might, depending on the frequency, use a current source and sensitive voltmeter to detect the impedance and give a more accurate result.


Leave a Reply
You must be logged in to post a comment.