Most engineers today are sensitive to problems that arise when digital measurement instruments try to capture signals containing frequencies that are too high for the sampling circuitry to handle–undergrad EE programs typically cover Nyquist’s sampling theorem. Nevertheless, there are terms associated with sampling problems that sometimes get confused. Probably the three concepts most likely to cause issues are under-sampling, aliasing, and folding.
To sort out the definitions, we start with a quick review of Nyquist’s theorem, now usually expressed as the Nyquist-Shannon Sampling Theorem. Shannon’s version came much later than Nyquist’s original specification. It states that if a signal X(t) contains no frequencies higher than B hertz, it is completely determined by giving its ordinates at a series of points spaced 1/2B seconds apart. A sufficient sample rate is therefore anything faster than 2B samples/sec. Equivalently, for a given sample rate fs, perfect reconstruction is guaranteed possible for a bandlimit B below fs/2. The threshold 2B is the Nyquist rate.
 Whenever the sampling rate is below the Nyquist rate, the signal of interest is said to be undersampled. Aliasing results when undersampling takes place. Specifically, aliasing arises when two signals override each other and become indistinguishable, a reason why they’re called ‘aliases’ of each other. In the case of undersampling, the signal reconstructed from the samples coincides with the original signal only at the sampled points. The resulting signal reconstruction is said to be a low-frequency alias of the original because it has a frequency lower than that of the original.
An interesting case arises when the sampling frequency exactly coincides with the frequency of the sampled waveform. Here, the reconstructed waveform will have the same frequency as the original but with a smaller amplitude. The reason is that the original waveform is sampled at precisely the same point in each cycle. If that sampled point happens to lie below the peak amplitude, the reconstructed waveform takes on the amplitude of the sample.
 The Nyquist frequency is also called the folding frequency. The term arises because reconstructed aliased frequencies are said to “fold” around half the sampling frequency. Folding typically arises in displaying signals on spectrum analyzers. It is common for acquired signals to have a fundamental frequency less than half the sample rate, but their harmonics may exceed half the sample rate. Consequently, they will alias. The aliased frequencies show up on the FFT display as frequencies that are said to fold back into the display.

Of course, an obvious way to identify aliases is to boost the sample rate. This causes the aliased signals to unfold. And if you are lucky enough to have the capability of increasing the input signal’s frequency (as when it’s coming from a signal generator), you have another approach available. As you boost the input frequency, the non-aliased harmonics will move toward the right-hand side of the screen. But the aliased harmonics will move toward the left. When they reach the edge, they will reflect back into the display and begin moving toward the right again.
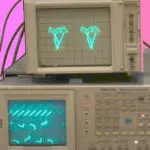
There are fewer options for detecting aliased signals on oscilloscope displays. The main approach is to change the time/division, peak detect, and the record length settings and watch for changes in the scope display.


Leave a Reply
You must be logged in to post a comment.