Often a transmission line is buried, concealed behind finish surfaces, or otherwise not readily accessible. So it is difficult to locate faults by means of visual inspection. It is, however, feasible to locate such discontinuities via a test instrument known as the time domain reflectometer (TDR).
The TDR is sometimes compared to a radar installation, the difference being that the medium involved is a transmission line rather than air or free space. The TDR sends an internally-generated pulse down the conductor. If there is a discontinuity or if the transmission line has an open fault, the TDR displays on its front-panel screen the reflected waveform, from which the user can determine the nature of the fault.
The instrument also displays the time taken for the round trip from which the user can deduce the distance to the fault. One use for the TDR is to locate discontinuities in printed circuit boards, where traces carrying high-frequency data pulses or RF waveforms are essentially transmission lines. If a trace on a PCB abruptly widens or narrows, the change will show up as an anomaly, causing reflections and data corruption.
The TDR can be used to examine any electrical path. For example, it can check cable on a reel prior to installation or to check out-of-circuit connectors. The optical time domain reflectometer (OTDR) performs similar tests on optical fiber, particularly single mode, often installed as long underground or aerial lines.
If a transmission line is correctly terminated and is of uniform characteristic impedance, the signal will not reflect back to the TDR. Instead, it is absorbed by the termination at the far end. The user can determine the impedance of the line by observing the amplitude of the reflected signal. If the load on the TDR output is purely resistive, the height of the reflected signal as shown in the display varies with the resistance.
TDRs are capable of applying a variety of pulses. TDR resolution is generally the width of the pulse. A narrow pulse provides better resolution, but is prone to attenuation in long runs due to the fast rise times involved, which are composed of high-frequency components.
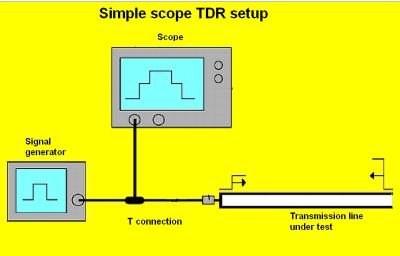 Because of its substantial expense, many test facilities may not have a TDR. There is, however, a low-cost alternative that requires an oscilloscope and a signal generator. Additionally, BNC connectors, a length of coax and accurate loads are needed.
To get started, the signal generator is connected to the oscilloscope, using a T connector and a short segment of coax. Keep this line short, to avoid introducing error. One end of the T connector goes to the cable under test. So you have the signal generator and cable-under-test connected in parallel through the T connector to an available analog channel input in the oscilloscope. In the signal generator, select a pulse with fast rise time, with an open circuit at the far end of the cable under test. The incident wave and the reflected wave are shown simultaneously relative to the oscilloscope’s Cartesian co-ordinates. Use oscilloscope cursors to measure time delay.


The relative permittivity and permeability of the cable’s dielectric slows signal speed phase velocity, Vp. Phase velocity is
Vp=C/√(μrεr)
where C is light velocity, μr and εr are cable permeability and dielectric constants. The time tL it takes for the incident signal to travel to the load is
tL= l/Vp
where l is the length of the conductor under test. Because coaxial dielectrics generally have a relative permeability close to one, it is often ignored in phase velocity calculations when coax is the media.
In the case where the cable-under-test is unconnected at the other end, the scope displays a waveform that resembles two steps. The incident wave is the bottom step, the reflected wave is the top step. The delay time is the time between the beginning of the first step and the beginning of the second step. Then the cable length is given by the measured delay time multiplied by the previously calculated Vp, of course, making sure units are consistent.
The most basic requirement for TDR is to provide sufficient resolution for locating faults. TDR resolution is set by the rise time of the pulses used. The resolution limit for TDRs is typically defined as half the 10% to 90% risetime or 90% to 10% fall time (depending on whether the TDR response is calibrated with a short or open circuit.
You can figure out the rise time from the frequency of the waveform only when the waveform used is a sine or cosine. In this case, the rise time is approximately one-third of the period of the waveform (the period is the inverse of the frequency). Thus, a 100-Hz sine wave has a rise time of one-one hundredth of a second, or about 3.3 msec. If you use some other kind of waveform, you’ll need to determine rise time via cursors on the scope screen placed at the 10% and 90% points of the pulse edge.
Rise time and resolution limits illustrate where the scope-based approach to TDR runs out of steam. The typical signal generators built into moderately priced scopes typically can generate frequencies up to about 100 MHz. Scopes with faster signal generators tend to be pricey. The rise time of a 100 MHz sine wave is about 3,300 psec. This it probably enough to resolve a fault down to about one meter–multiple faults spaced more closely than about a meter will all look like a single problem. In contrast, the T3SP15D TDR from Teledyne LeCroy lists a rise time of 35 psec and a spatial resolution below 3 mm. This is the kind of resolution necessary for finding faults on traces within densely populated circuit boards.
Thus the home-brew TDR has less accuracy and fewer features that the professional TDR, but it may impress neighbors when you find the break in their buried electrical line.


Leave a Reply
You must be logged in to post a comment.