Thermal noise, also known as Johnson-Nyquist noise, is generated by thermal agitation of charge carriers inside an electrical conductor or component regardless of any applied voltage. A small voltage can actually be measured across a wire segment that is at non-zero temperature and lying on a non-conductive surface.
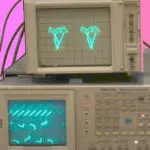
Apprentice electricians are puzzled by this phenomenon, which is misleadingly called phantom voltage. In a digital multimeter, it manifests as wandering digits in the display. As soon as a “real” voltage is accessed, the meter locks onto it and the phantom voltage goes away. The phantom/real voltage appears because the multimeter is auto-ranging and with no external signal, its sensitivity rises so the fluctuating thermal noise can be detected and displayed. This effect appears also in the noise floor of an oscilloscope or spectrum analyzer. Thermal noise also appears as sound in a radio that is tuned to no station. The automatic gain control increases the amplification and the you hear an audible hiss, the sound of electrons moving and colliding.
There are a number of ways to reduce noise effects in measurements. Thermal noise is a broadband phenomenon, so one way to reduce it is by placing a filter at the input of the receiving instrument. Another approach: cut the instrument’s bandwidth, though this method is not effective at high frequencies where full bandwidth is needed.
A word about ac and dc coupling on the scope input: The ac coupling mode on the scope input basically puts a capacitor in series with the input signal to block the dc. It’s rare to find the value of this capacitor in scope specs. But a typical value is 0.022 μF which causes a 3 dB roll-off of the displayed signal below about 7 Hz. This filtering effect should be kept in mind when it comes to noise problems.
One particular thermal noise mitigation method is known as phase-sensitive detection. This one works if you know the qualities of the signal you are trying to see. There is a good YouTube video that covers the basic approach. Briefly, this method allows viewing a signal that, say, is on the order of a few millivolts in the presence of noise that is orders of magnitude stronger.
The basic approach for phase-sensitive detection is to feed the signal of interest to one scope channel, then feed the source of the signal to another channel. For example, the YouTube demonstration of this concept fed a light sensor output as the signal of interest. It monitored a laser driven by a square wave from a signal generator. The square wave from the signal generator went to the second scope channel, which was also used to trigger the display. This set up allows a measurement of the phase delay between the signal generator and the resulting signal of interest, as well as a measurement of the signal magnitude.

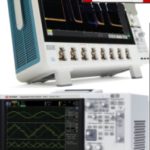
It is also useful to examine measurement instruments connected to the DUT with noise in mind. Modern scopes, of course, are digital and display acquired signals via an analog/digital converter. To minimize noise effects, the acquired signal should span the ADC’s entire range. There are two tools for adjusting the signal range: probe attenuation and the scope front end. Two potentially significant sources of measurement noise arise from the oscilloscope attenuator and the amplifier in the scope probe.
The attenuation ratio of the probe sets the maximum and minimum signal size the scope can accommodate. A 1:1 attenuation ratio leaves the signal as is. A 10:1 probe reduces the signal by a factor of 10 before it reaches the scope input; 100:1 scales it down by a factor of 100. That said, higher attenuation ratios lead to more signal noise because the noise form scope’s front-end amplifier gets amplified. For example, consider picking up a 1-V signal with a 10:1 probe. The signal amplitude is reduced by a factor of 10 to 100 mV before being passed to the ADC. But the amplifier noise is not attenuated. Thus the signal-to-noise ratio of the resulting signal may suffer. When the signal-plus-amplifier noise goes through the ADC, it is displayed as a 1-V signal. But the displayed signal consists of the signal multiplied by 10 plus the amplifier noise, also multiplied by 10.
Thus the best practice is to make the signal as large as possible on the screen to fully use the ADC and reduce noise.
Of course, the probe itself contributes some noise no matter what attenuation ratio is used. Perhaps the easiest way to estimate the amount of probe noise is to check the attenuation ratio and probe noise level from the probe data sheet. Many probe makers characterize the probe noise as an equivalent input noise (EIN) that is listed in units of volts rms.


Leave a Reply
You must be logged in to post a comment.