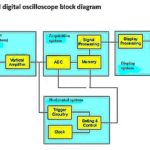
In a digital oscilloscope, the analog signal is at the input, after attenuation/amplification and preliminary filtering such as for ac coupling, goes to an analog-to-digital converter (ADC). Each channel has a separate ADC, each with an external clock. Analog-to-digital conversion takes place by means of sampling. The samples are taken at specific rates and the amplitude of each sample is measured and stored. Intuitively, we know that the accuracy of the digital signal at the output depends upon the number of samples that are taken.
What is surprising is that a limited number of samples is sufficient to digitize any analog signal of finite bandwidth with perfect fidelity. Fidelity in this context means with respect to the original analog signal. The implication here is that you could theoretically convert back and forth any number of times with no loss of information except due to increasing amounts of noise that would accumulate and also other inherent limitations of the equipment.
The Nyquist-Shannon sampling theorem, based on work by Harry Nyquist in a paper titled Certain Factors Affecting Telegraph Speed (1924) and definitively stated by Claude Shannon in a paper titled A Mathematical Theory of Communication (1948), establishes the minimum sampling rate that permits a discrete sequence of samples to capture all the information from a continuous-time signal of finite bandwidth. This sample rate is twice the highest frequency component of the signal. (The frequency and sample rate are both expressed in the same units of time, such as seconds.)
Notice that the frequency here is not necessarily that of the fundamental, except in the case of a sine wave. It is the frequency of the highest harmonic. Accordingly, the sampling rate is based on the complexity in the Fourier sense as well as the frequency of the signal. Of course, the oscilloscope does all this for you. Apply an analog signal at the input and it is instantly digitized and displayed on the flat screen.
There are multiple sampling modes. To see how they work, power up the oscilloscope and turn on one or more channels. There is no need to apply a signal through a probe or BNC cable. What is displayed is a zero-amplitude waveform. (You may have to press Autoset, depending on the last thing you did with the oscilloscope.) Notice that the trace wiggles in an irregular fashion and is noticeably thick. This is due to the noise floor of the instrument. With zero volts displayed, the sensitivity of the oscilloscope is turned way up.
To see the sampling modes in a Tektronix MDO3000 Series oscilloscope, press Acquire. The Acquisition Menu appears below and the first item on the left is Mode. When you press the associated soft key, the vertical acquisition mode menu appears on the right, revealing the five types of sampling. Sample mode is default, and it is used most of the time. The others are Peak Detect, High Resolution, Envelope, and Average. It is instructive to press each soft key in turn to see how the noise floor is affected. Also, you can apply various signals from the AFG to the active channel and observe the effect of each acquisition mode. When the AFG output is scrolled to Noise, the effects of the different acquisition modes are especially dramatic.
Sample mode is the default, and as such, it is the mode that is used most of the time. It is simple and fundamental. It fulfills the sampling function by retaining the first sampled point from each acquisition interval. Sample mode delivers the highest accuracy for timing interval measurements. It displays the first point from each sample interval, discarding all others. In many instruments, sample mode exhibits the highest possible sample rate by interleaving two or more channels.
Peak Detect sampling mode uses the highest and lowest of all samples contained in two consecutive acquisition intervals, then displays all the samples between the two values, inclusive. It is especially useful at slower sampling rates because the user can see any extremes that occurred during the sample interval. Peak detect works only in real-time, non-interpolated sampling. One advantage is that it can display high-frequency glitches.
High-Resolution mode calculates the average of all the samples for each acquisition interval. This mode also works only with real-time, non-interpolated sampling. High-resolution mode provides a higher-resolution waveform at the expense of lower bandwidth. It takes advantage of the digitizer’s highest possible sampling rate for greatest detail without interleaving channels. With greater data per sample interval, High-Resolution mode maximizes vertical resolution. Sample, Peak Detect, and High-Resolution modes operate in real time, using the acquired data from one trigger event, so these modes work for the most demanding measurements at frequencies approaching the instrument’s upper bandwidth. Other modes require a repetitive signal.
Envelope mode finds the highest and lowest record points over all acquisitions. Envelope mode uses Peak Detect mode for each individual acquisition. It synthesizes a waveform envelope from the highest maximum values and lowest minimum values among the corresponding samples from successive trigger events. Envelope mode is useful on repetitive waveforms, where it minimizes aliasing.
Average mode calculates the average value for each record point over a user-specified number of acquisitions. Average mode uses Sample mode for each individual acquisition. Use Average mode to reduce random noise.
One could mistakenly believe that the task is complete once an ADC, in one of the acquisition modes, samples the analog signal. The reality is more complex. The sample must be quantified in digital (usually binary) terms before it can participate in creating the display.
There are various ways in which this action arises:
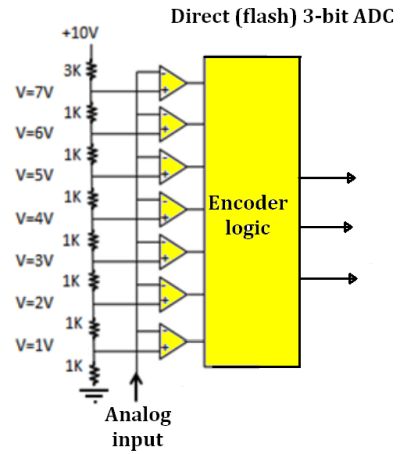
 • Direct conversion – An array of parallel-connected comparators samples the input. They apply a voltage to a logic circuit, which generates a separate code based on the voltage level.
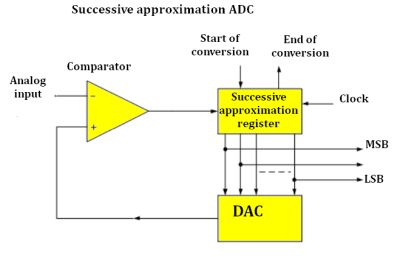
• Successive Approximation – A comparator successively approximates the voltage, which is compared to a DAC output. After several steps, each narrowing in on a smaller range, the desired resolution is attained.
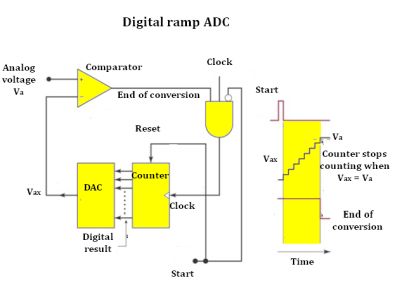
• Ramp Compare – This involves a saw-tooth signal. A timer turns on when the ramp begins. When the ramp voltage equals the input, the comparator turns on and the value of the timer voltage creates the ADC output. This simple implementation can be made insensitive to temperature fluctuation by using a quartz oscillator to clock the circuit.
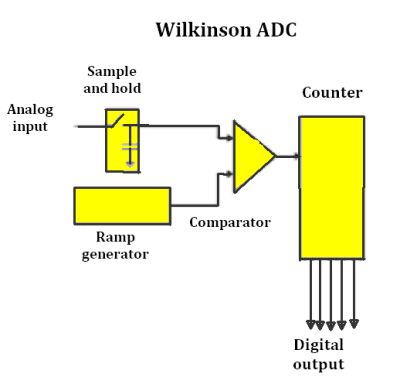
• Wilkinson – This type of ADC compares the voltage at the input to that of a charging capacitor. A comparator determines when the input voltage and the capacitor voltage are equal. Then the capacitor discharges in a linear manner, creating a ramp voltage. The amount of time required for the capacitor to discharge is a measure of the input amplitude. A high-frequency clock measures the discharge period and the number of pulses is counted in an address register to determine the amplitude of the waveform at the point where it is sampled.
There are also Integrating (Charge Balancing and Dual Slope), Delta-Encoded, Pipelined, Sigma-Delta, Time-Interleaved, Intermediate FM Stage and other types of ADCs.
Digital processing is a vast subject. Besides the oscilloscope and other waveform-imaging instruments, it appears in a great many areas, including computing, photography, printing, sound reproduction and others. In all cases, a sequence of numbers, in the binary system 0s and 1s, is used to represent analog values, which usually change with time sequence or spatial position.

Leave a Reply
You must be logged in to post a comment.