As with many medium to high-end scopes, the Tektronix MDO 3000 Series Oscilloscope has an internal built-in arbitrary function generator. It is capable of producing 13 different waveforms – sine wave, square wave, pulse, ramp, dc, noise, sin(x/x), Gaussian, Lorentz, exponential rise, exponential decay, Haversine and cardiac.
Any of these waveforms can be displayed on the oscilloscope or on another, separate scope or spectrum analyzer that has an analog input with a BNC port. Simply run a BNC cable from the AFG output on the rear panel to one of the analog channel inputs on the front panel, or to the RF input with an RF adapter, and the waveform will display.

It may be necessary to press Autoset if the previous oscilloscope setting, which is preserved even when the instrument is power-cycled, differs substantially in terms of frequency and amplitude from the current signal.
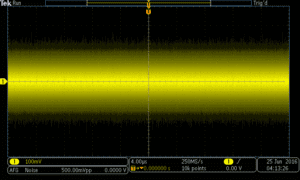
In the AFG mode, the contextual menu that appears below the display includes Waveform settings. Frequency, amplitude, and duty cycle where applicable may be set. One of the waveforms is Noise, and if you use the multipurpose knob a to select it, a typical noise signal displays.
This display well illustrates the nature of noise. Random frequency and amplitude variations as displayed characterize the waveform.
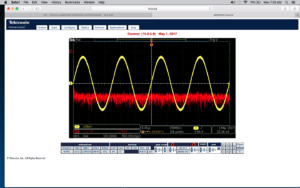
Additionally various amounts of noise can be added to a sine wave or to any of the other signals in the Tektronix AFG library. The percentage of added noise can be selected going to Output Setting > Add Noise. Then, by turning Multipurpose knob a, the operator chooses the percentage of noise to be added. When adding noise to a sine wave, to take one example, it is interesting to note that above a certain level, around 15%, triggering is lost and the repetitive signal becomes unstable.
By definition, noise is electrical or electromagnetic energy that obscures the signal of interest.
Noise above a certain level is almost always harmful. It can be characterized by its source or by other qualities of the noise signal:
• Johnson or Nyquist noise is random in nature and refers to the voltage across a resistor resulting from thermal fluctuations.
• Shot noise, also random, consists of statistical current fluctuations analogous to Brownian motion in a physical system.
• Flicker noise, reciprocally related to frequency, can have any number of causes. It is quite audible due to its characteristic low frequency.
• Burst noise, as the name implies, consists of abrupt and random events typically caused by an intermittent wiring termination.
• White noise arises evenly across a broad frequency spectrum. In the RF spectrum, it’s source is the Big Bang thought to have started the universe 13.7 billion years ago. RF white noise is actually photons whose frequency has dropped over eons to a point where they have wavelengths in the radio wave spectrum.
• Red noise (or Brownian noise) is a signal whose power per Hertz varies with 1/f2.
• Pink noise is a signal whose power per Hertz varies with 1/f.

Noise can be clearly seen in an oscilloscope or spectrum analyzer by looking at the noise floor. In the Tektronix MDO 3000 Series Oscilloscope, the noise floor can be seen in either of two ways. In the analog mode, press Math and then FFT. The resulting frequency domain display, whether or not a signal is present, will contain a low amplitude irregular trace. This is the noise floor of the instrument and is a consequence of the fact that the oscilloscope’s sensitivity is high enough to make the noise floor visible on the display.
The other way to see the noise floor is to press RF with no signal at the input. Here again the gain is high enough to reveal the noise floor. This noise originates within and outside the instrument enclosure. Outside noise is electromagnetic radiation that is everywhere except in shielded quiet environments (Faraday cages). Certain parts of an oscilloscope act as antennas, picking up this noise. The other source of noise that comprises the scope noise floor is internal and primarily thermal in nature.
A strange fact is that any resistor, even one not connected to circuitry, will exhibit a definite voltage. Moreover, if the leads are shunted together so there is a good electrical connection, current can be measured at every point throughout the circuit that has been created. This is true inside the resistor as well, in accordance with Kirchhoff’s current Law. Needless to say, the waveform of the voltage or current is not a sine wave, square wave, pure dc or anything of the sort. It is noise.
The other thing to realize is that everything is a resistor except for a superconductor at close to absolute zero degrees Kelvin. A length of copper wire has some finite resistance. In fact, all electronic devices exhibit thermal energy.
The voltage across an unconnected resistor is caused by the activity of the atoms, ions and free electrons that it contains. The amount of voltage or current is a function of the temperature and resistance of the device as well as the bandwidth at which the measurement is taken. The voltage or current generated by the thermal fluctuations is, as we have seen, Johnson or Nyquist noise. This type of noise has a flat frequency spectrum. In other words, it has the same power at each frequency until at high frequencies, weird effects take over. Due to the flat spectrum, this thermal, Johnson or Nyquist noise that is responsible for the voltage across or current through a resistance falls into the category of white noise.
The amount of RMS voltage across an open circuit resistor is of course small:
Vnoise = (4kTRB)1/2
Where
Vnoise = The measured RMS voltage across the resistor
k = Boltzmann’s constant
T = Absolute temperature in degrees Kevin
R = Resistance in ohms
B = Bandwidth of the measurement taken (Δf) in hertz
At room temperature, a 10 kΩ open-circuit resistor measured with a bandwidth of 10 kHz, would have across it 1.3 μV. (That’s not much energy, but with other voltage sources within and outside a sensitive instrument, a noise floor is created.)
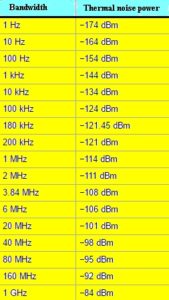
Signal power is often measured in dBm (decibels relative to 1 mW). From the equation above, noise power in a resistor at room temperature, in dBm, is then:
PdBm= -174+10 log(Δf)
 The noise voltage across a resistor is unpredictable at any given instant, except only insofar as it conforms to a Gaussian amplitude distribution. Nevertheless, over the long haul, its steady ongoing presence severely impacts the ability of any instrument to take low-level measurements. When the amplitude of the signal of interest falls below a certain level, it is lost within the noise floor and cannot be displayed or measured. But the noise floor should not be seen as a defect or design flaw. It is always there, visible in the display or digital readout due to the extreme sensitivity of today’s outstanding instruments.
Astrophotographers, using charge-coupled device (CCD) digital cameras, face a similar problem. Hours-long exposures used in old film photography to bring out extremely faint celestial objects are not viable in digital cameras because the sensors as they heat inexorably accumulate electronic noise, which is stored in the memory in the form of glowing speckles – false stars. To deal with this problem, rather than a single long exposure, numerous short exposures are made, then stacked in computer programs.
Another technique is to cool the sensor. CCD cameras with internal cooling are available, although amateurs get excellent results by placing ice in plastic bags over their cameras. To reduce the noise floor, an oscilloscope user can endeavor to operate the instrument in a cool environment with impeccable air circulation.
In measuring a low-level signal that is obscured by noise, i.e. where there is a low signal-to-noise ratio, there is a highly effective technique that will dig the signal out from under the noise floor. It is accomplished by limiting the measurement bandwidth of the signal of interest. The rationale for this is that white noise, the prime offender, is evenly spread over a wide bandwidth. Large portions of this spectrum may be higher frequency than the focus of the investigation.
If the bandwidth is limited, a large amount of noise will go away, thereby cleaning up the signal. This may be accomplished incrementally, pressing the bandwidth soft key. In the submenu, bandwidth may be limited to two lower levels. The plan should be to find the optimum display. Of course if the signal itself extends into the high-frequency regions, the technique will not work. At the end of the project, don’t forget to restore full bandwidth!
Another method for noise mitigation in a contemporary oscilloscope is by means of signal averaging.

David, I just wanted to say thank you for your well-written and thoughtful article. I am looking at noise in many systems, including image sensors for astro-photography. Your comment about bandwidth limiting as a practical solution is intriguing. Will have to dig deeper on that one. I have never iced a camera, but I did put some in the freezer, and I am considering dry ice and liquid nitrogen.
These tips on this site are helpful and fun to read. I am trying to see how people measure and record fluctuations in transmission lines and in optical paths. I am a mathematical statistician and can do wonders with data, but actually getting the data is hard and often very expensive. I keep trying to find “easy and inexpensive”, but it is rare.
An odd problem came up today. I have been looking at cooled astrophotography using high frame rates (the region of interest cameras are in the hundreds of frames per second, and some up to hundreds of thousands per second.) Raise the gain and increase the frame rate for a fixed signal strength. Or increase the gain and shorten the exposure (sample time) with random sampling in time. But I wondered how the peltier coolers are powered (I skipped electronics lab to take quantum mechanics and electrodynamics). And if, at high frame rates, the image intensity is going to change with fluctuations in the Peltier drivers.
As often happens, when I try to write a question, it helps me focus. So I googled / fluctuations current peltier temperature / and found
Driving a Peltier Element (TEC): Efficiency and Aging
https://www.ti.com/lit/an/slua979a/slua979a.pdf
Whoa!! Their Peltier Aging records are beautiful. I wish I could add an image clip to this message. They only measured every 20 minutes and were aiming to cool to a fixed temperature between ambient and cold side. Now I want to look from microHertz to MegaHertz, just so see. You have to appreciate someone who will measure for a month or more.
It is PDF so you cannot just open the data and look as deep as you want. What a shame. The people doing that study have wonderful data, and it gets chopped flat by having to publish in a lossy format – no better than “lampblack ink on papyrus”.