Various types of signal acquisitions in a digital storage oscilloscope are examined and displayed.
Hi again and welcome to our 81st Test and Measurement Video. For this demonstration we’ll return to the Tektronix MDO3000 oscilloscope and talk about the meaning and some details of signal acquisition.
This concept is far more complex in the digital storage oscilloscope (DSO) than it was in the old all-analog scope, where the voltage at the input was simply amplified and applied to the cathode ray tube vertical deflection plates to move a beam of electrons that would trace waveforms on the screen.
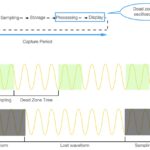
In the DSO the signal passes through the input channel where it is amplified and/or attenuated, then scaled and digitized in the analog to digital converter (ADC), one for each channel. The instrument samples this data stream and governed by user selected protocols, extracts samples and creates waveform records which are placed in the acquisition memory.
Real-time oscilloscopes such as the MDO3000 instruments, in their simplest routine, digitize all acquired points in a single trigger event. But as we shall see, there are variations in this procedure, imposed by the user for specific purposes.
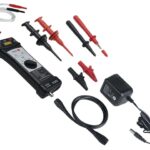
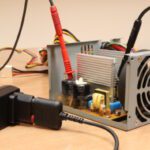
To see how all this plays out, first we’ll place a signal at an analog channel input and then see how we can modify the acquisition process. A variety of signal sources are possible. A probe can pick up waveforms from energized circuit boards. It is useful to remove a small working battery-powered AM-FM radio from its enclosure so that signals can be extracted, displayed and measured, going from the outputs of the power supply and tuner to the speaker. Don’t expect to detect a signal at the antenna terminals, but check out the local superheterodyne oscillator with varying frequency outputs as you sweep the broadcast bands.
Oscilloscope manufacturers offer demo boards that have a variety of signals. There is no reason why signals from competing vendors’ boaard cannot be displayed in your instrument as long as voltage limitations are observed. Utility voltage from a premises branch circuit is a possibility as long as hazardous voltage is not contacted and any voltage referenced to but floating above ground potential is not applied to the probe’s ground return lead.
An excellent source of signals for demonstration purposes is an aritrary funtion generator (AFG), either fro within the oscilloscope or as a separate stand-alone instrument. For this demonstration, we’ll use the internal AFG, connected via BNC cable to the Channel One input. Pressing AFG and with Channel One turned on, the default sine wave appears on the screen, and it is suitable for demonstrating basic acquisition concepts.
The waveform record is constructed by the sampling process, which may take various user-chosen forms. It is automatically placed in the acquisition memory.
The waveform, as placed in the oscilloscope’s acquisition memory, is constructed in accordance with various user-selected parameters:
• The sample interval is defined as the time between recorded sample points. This interval can be adjusted either by turning the horizontal scale knob or by pressing
Acquire and changing the record length in the acquire menu.
• Record length is a related metric. It is the number of samples required to fill a waveform record. The user can set record length by pressing the Acquire button and
using the lower and sid menus.
• Trigger point is denoted on the screen by an orange T.
• Horizontal position is the time from the trigger point to the expansion point when Delay mode is On. It can be adjusted by turning the Horizontal Position knob. Use a
positive time to acquire the record after the trigger point. Use a negative time to acquire it before the trigger point.
• Expansion point is denoted by an orange triangle. It is the point that the horizontal scale expands and contracts around.
When Acquire is pressed, the Acquisition menu appears across the bottom of the screen. The first menu selection is mode and the default mode is sample which retains the first sample point from each acquisition interval Sample is the default mode and it is the most basic.
Peak Detect mode uses the highest and lowest of all samples contained in two consecutive acquisition intervals. This mode works only with real-time, non-interpolated sampling. It is used to display high-frequency glitches.
High resolution mode calculates the average of all samples for each acquisition interval. This mode also works only with real-time non-interpolated sampling. It provides higher resolution at the expense of lower bandwidth.
Envelope mode finds the highest and lowest record points over all acquisitions. Envelope mode uses Peak Detect for each individual acquisition.
Average mode calculates the average value for each record point over a user-specified number of acquisitions. Average uses sample mode for each individual acquisition. Average mode is highly effective in reducing noise. The way it works is that successive acquisitions that are averaged are periodic and coincide, so these signals reinforce one another. Noise, however, is random so it cancels out rather than reinforcing.
To illustrate how waveform averaging can clean up a noisy signal, press AFG so that the sine wave is displayed. In Output Settings, add 25 percent noise. Notice how the sine wave signal has become distorted, even to the extent that triggering is lost. Now, press Acquire to bring up the Acquisition menu. The fifth menu selection is average, and as you press the associated soft key, the default number of actquisitions that are averaged to construct the waveform record takes effect. This number of acquisitions that are averaged is 16, and we notice that the signal is now somewhat less noisy and triggering has been largely restored. We also notice that the number of acquisitions that are averaged is controlled by Multipurpose Knob a. Disabling Fine and turning the knob counter-clockwise, the number of averaged acquisition drops to two and the signa once more becomes noiser. Turning Multipurpose Knob a clockwise increases the number of averaged acquisitions to its maximum, 512. Notice now that the signal is less distorted with most of the noise averaged out of the waveform.
Thanks for watching. New videos are added periodically, so check back frequently.


Leave a Reply
You must be logged in to post a comment.