• Skip to primary navigation
  • Skip to main content
  • Skip to primary sidebar
  • Skip to footer
  • Advertise
  • Subscribe

Test & Measurement Tips

Oscilloscopes, electronics engineering industry news, how-to EE articles and electronics resources

  • Oscilloscopes
    • Analog Oscilloscope
    • Digital Oscilloscope
    • Handheld Oscilloscope
    • Mixed-signal Oscilloscope
    • PC-based Oscilloscopes – PCO
  • Design
  • Calibration
  • Meters & Testers
  • Test Equipment
  • Learn
    • eBooks/Tech Tips
    • FAQs
    • EE Training Days
    • Learning Center
    • Tech Toolboxes
    • Webinars & Digital Events
  • Video
    • EE Videos
    • Teardown Videos
  • Resources
    • Design Guide Library
    • Digital Issues
    • Engineering Diversity & Inclusion
    • Leap Awards
    • White Papers
  • Subscribe
You are here: Home / Featured / What is a Smith chart and why do I need one? (Part 1)

What is a Smith chart and why do I need one? (Part 1)

January 23, 2023 By Rick Nelson Leave a Comment

A Smith chart provides insight into RF/microwave designs. Even if you work primarily with low-speed analog and mixed-signal designs, you could benefit from familiarity with the Smith chart as wireless products proliferate and as high-speed-serial data signals exhibit microwave-like effects.

lumped-element impedance model
Figure 1. With a lumped-element impedance model, perfect conductors carry currents at infinite speeds.

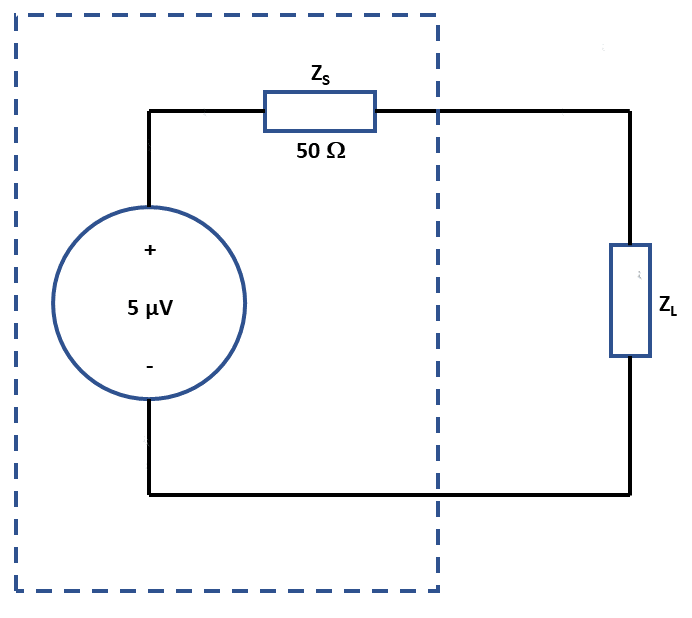
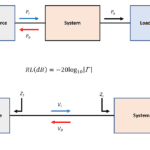
When a signal’s wavelength (λ) approaches the lengths of the conductors carrying it, you can no longer rely on the lumped-element impedance model represented in Figure 1, in which perfect conductors carry currents traveling at infinite speeds.

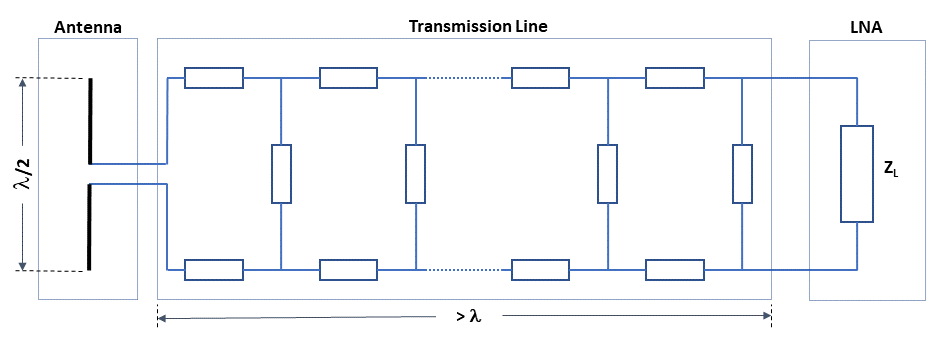
With RF signals, think instead of a transmission line consisting of an infinite series of distributed impedances (Figure 2). The Smith chart simplifies calculations involving complex numbers in the form of x + jy, which come up frequently in RF/microwave designs that involve transmission lines and require impedance matching.

distributed-impedance model
Figure 2: Use a distributed-impedance model when a signal’s wavelength approaches the length of the conductor carrying it.

Why do impedance matching?
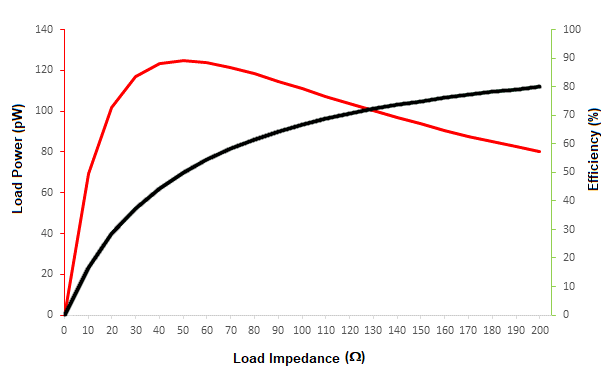
Two reasons. First, given a source with a fixed impedance (50 Ω in Figure 1), the maximum power transfer theorem states that the maximum amount of power transfers to a load if the load impedance matches the source impedance. Figure 3 plots load power (red curve) vs. various load impedances (horizontal axis), showing that the load absorbs maximum power when it matches the source’s impedance. You are probably familiar with this theorem. The values shown in Figure 1 approximate what you might find working with a receiving antenna, but the theorem applies to DC and low-frequency designs at high voltages as well. (Note that an antenna signal level would generally be expressed in dBm, not µV, but the voltage value helps show how the theorem works.)

Yes, but something doesn’t sound right — if the impedances match, how could efficiencies ever be higher than 50%?
Note that the theorem says nothing about designing source impedance to match a given load impedance — for DC designs, you should minimize source impedance regardless of load impedance. The black trace in Figure 3 plots efficiency, which indeed is 50% at the 50-Ω point, but efficiency continues to climb as the load impedance increases, although overall power falls.

power transfer curve
Figure 3. Maximum power transfer occurs when load impedance equals source impedance, but for low-frequency circuits efficiency continues to increase as load impedance increases.

The theorem applies when you have a fixed, unalterable source impedance. If, as in Figure 2, you are using a half-wavelength dipole antenna to receive a signal, the antenna presents a source impedance of (73 + j45) Ω, which you must consider when choosing a transmission line, low-noise amplifier (LNA), or other components.

So, I should match impedances when receiving a signal but minimize source impedance when transmitting?
No! I mentioned there are two reasons for impedance matching at RF frequencies. The second is to minimize reflections that impedance mismatches cause, calculated using the reflection coefficient Γ:

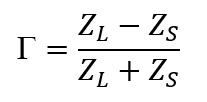
This equation shows that if ZS = 50 Ω and ZL = 150 Ω, half the incident power will reflect back from the load to the source. The reflected power never reaches your antenna and is dissipated as heat, possibly damaging your transmission line and power amplifier.

Smith chart
Figure 4. The Smith chart includes a plot of G and overlays it with circles and arcs representing impedance.

OK, I’m sold on impedance matching. How does the Smith chart help me?
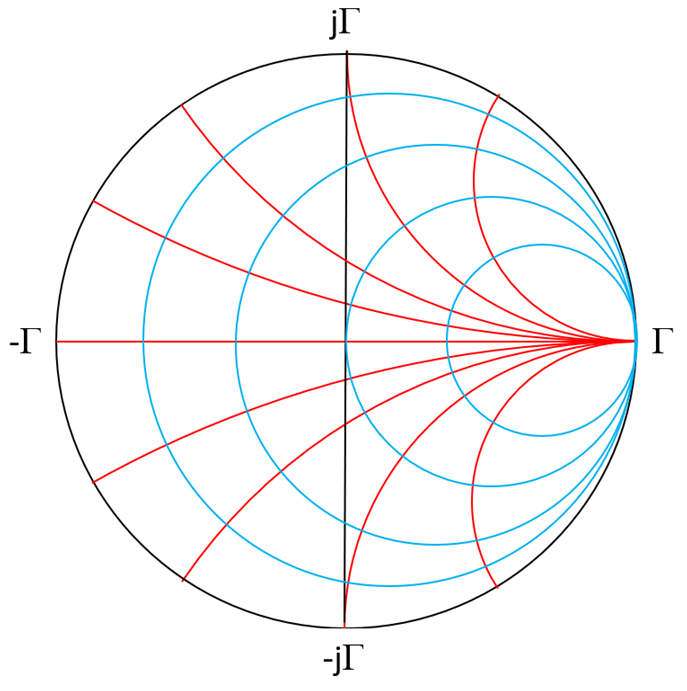
The Smith chart includes a plot of $Gamma; and overlays it with circles and arcs representing impedance to allow you to relate  to source, line, and load impedances. In Figure 4, Γ equals 0 at the origin, and its magnitude is 1 along the outer black circle. Each blue circle and red arc represent a locus of points of constant resistance and reactance, respectively.

Part 2 will add some specific numbers to this chart and demonstrate some calculations.

You may also like:


  • What are insertion loss and return loss and how can…
  • Smith chart
    What is a Smith chart and why do I need…

  • The difference between impedance analyzers and network analyzers
  • phase delay
    Do you really need a VNA when a scalar network…

  • A DIY vector network analyzer? Yes, there is such a…

Filed Under: Analyzer, Communication Test, FAQ, Featured, spectrum analyzer, wireless test equipment Tagged With: FAQ

Reader Interactions

Leave a Reply Cancel reply

You must be logged in to post a comment.

Primary Sidebar

Featured Contributions

Why engineers need IC ESD and TLP data

Verify, test, and troubleshoot 5G Wi-Fi FWA gateways

How to build and manage a top-notch test team

How to use remote sensing for DC programmable power supplies

The factors of accurate measurements

More Featured Contributions

EE TECH TOOLBOX

“ee
Tech Toolbox: 5G Technology
This Tech Toolbox covers the basics of 5G technology plus a story about how engineers designed and built a prototype DSL router mostly from old cellphone parts. Download this first 5G/wired/wireless communications Tech Toolbox to learn more!

EE TRAINING CENTER

EE Learning Center

EE ENGINEERING TRAINING DAYS

engineering
“test
EXPAND YOUR KNOWLEDGE AND STAY CONNECTED
Get the latest info on technologies, tools and strategies for EE professionals.
“bills

RSS Current EDABoard.com discussions

  • Right Half Plane Zero
  • dc-dc converter in series
  • Single ended measuring ports and balanced antenna
  • Thermal modelling of repetitive power pulse
  • Permittivity and Permealibility in CST

RSS Current Electro-Tech-Online.com Discussions

  • Fun with AI and swordfish basic
  • Microinverters and storeage batteries?
  • FFC connector white
  • Is AI making embedded software developers more productive?
  • Can I make two inputs from one??
Search Millions of Parts from Thousands of Suppliers.

Search Now!
design fast globle

Footer

EE World Online Network

  • 5G Technology World
  • EE World Online
  • Engineers Garage
  • Analog IC Tips
  • Battery Power Tips
  • Connector Tips
  • DesignFast
  • EDA Board Forums
  • Electro Tech Online Forums
  • EV Engineering
  • Microcontroller Tips
  • Power Electronic Tips
  • Sensor Tips

Test & Measurement Tips

  • Subscribe to our newsletter
  • Advertise with us
  • Contact us
  • About us

Copyright © 2025 · WTWH Media LLC and its licensors. All rights reserved.
The material on this site may not be reproduced, distributed, transmitted, cached or otherwise used, except with the prior written permission of WTWH Media.

Privacy Policy