Take a journey around a Smith chart to find capacitance and inductance values in a matching network.
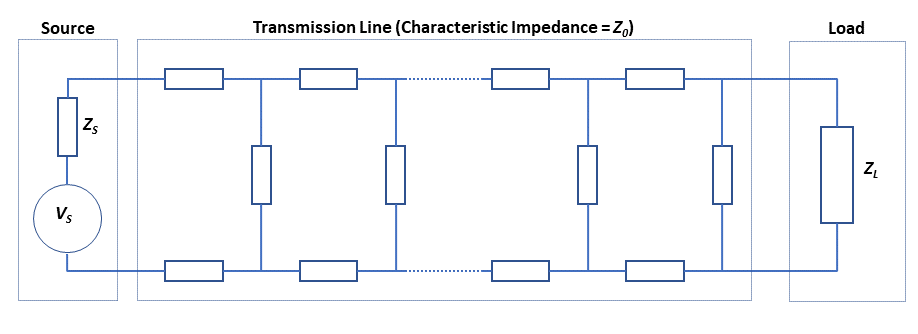
Before computers became ubiquitous, the Smith chart simplified calculations involving the complex impedances found in RF/microwave circuits such as the one shown in Figure 1. That circuit includes a source with impedance Zs, transmission line with characteristic impedance Z0, and load with impedance ZL.
The Smith chart remains valuable in helping to visualize how such circuits perform. Part 1 of this FAQ looked at why you might use a Smith chart. This part elaborates on the Smith chart’s construction and provides an impedance-matching example.
Where do we start?
Start by normalizing the impedances:
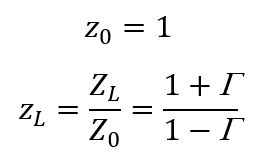
If Z0=50 Ω and ZL=100 Ω, then ZL=2. Normalization lets one Smith chart work with any characteristic impedance.
What’s Γ again?
It’s the reflection coefficient (sometimes denoted as ρ), which we discussed in part 1. You’ll also see it represented as the scattering parameter S11.

What about those circles from part 1?
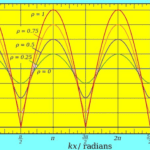
Noting that ZL is a complex number in the form of r+jy, you can manipulate the equation for ZL to determine that a locus of points representing constant resistance is a circle of radius 1/(r+1) centered at r/(r+1). Similarly, a locus of points representing constant reactance is a circle of radius 1/x centered at 1, 1/x. Figure 2 shows some of these circles plotted on a grid representing Γ. A resistance of 2 appears where the red r=2 resistance circle crosses the horizontal axis (point A), where you can see that Γ=0.333. Similarly, an impedance of 2+j1 is located where the red r=2 circle crosses the blue x=1 circle (point B), where Γ= 4+j2.

Your chart isn’t as elaborate as some I’ve seen.
I’m keeping it simple. But I can add some admittance circles to form an immittance chart (Figure 3), where admittance Y=g+jb=1/Z. You can do a lot of algebra to find these circles’ centers and radii, or you can just flip the impedance circles horizontally.
How can we use these circles?
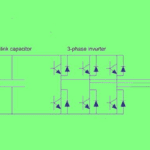
Consider a 1-GHz generator with a 25-Ω source impedance driving a 400-Ω load, for a horrendous Γ=0.882. We need an impedance-matching network. Because we’re not building an electric heater, we will use purely reactive components. I propose a simple LC circuit (Figure 4).
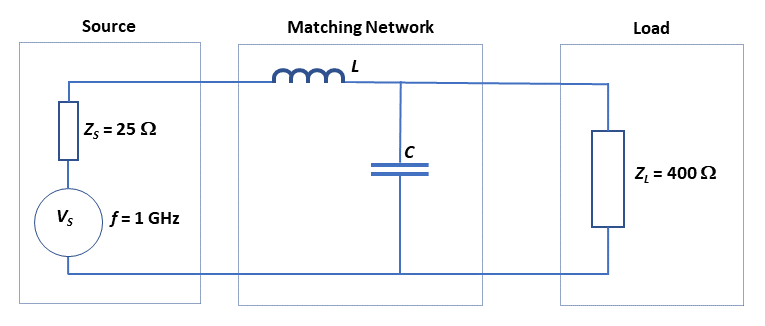
How do we find L and C?
We’ll map a journey on the Smith chart and compile a travelogue along the way. First, we normalize impedances. I’m choosing 100 Ω as our normalization impedance because, with the values in Figure 4, the map will spread out on the chart and be easy to follow. Our source impedance becomes 0.25 and our load impedance becomes 4. Next, we locate these points on the Smith chart. They are both real, so they fall on the horizontal axis, the source impedance where the r=0.25 circle crosses the horizontal axis (point A in Figure 5) and the load impedance where the r=4 circle crosses the horizontal axis (point C).
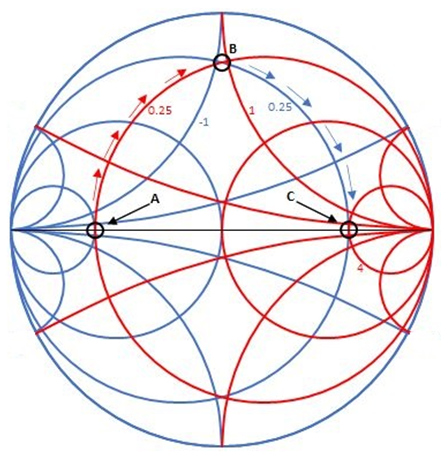
Because we don’t want to add resistance, we must find paths of constant resistance or conductance from point A to point C on the 0.25 red circle. We’ll head north from A along the red r=0.25 constant-resistance circle, adding positive reactance (inductance) as we go. At point B, we see a path straight to the load, a right turn along the blue g=0.25 constant-conductance circle. At point B, we make our first travelogue entry, noting the reactance. We are just to the left of the x=1 red reactance circle, so let’s call it 0.95. Before we depart, we also log the admittance. We are just to the right of the blue b=-1 constant-susceptance circle, so let’s call it -0.95. Because that’s an admittance, we invert it to find the impedance of -1.05, with the minus sign indicating capacitance. We then descend to point C, canceling the reactance added from A to B. We reverse the normalization to learn that the inductor and capacitor have impedances of 95 Ω and 105 Ω, respectively. Therefore, at f=1 GHz:
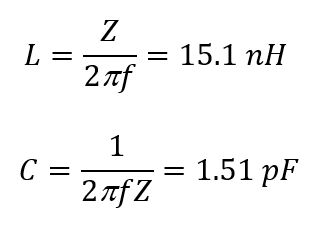

It seems there should be ways to automate this process.
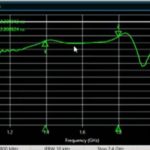
Indeed, RF/microwave design-automation suites have Smith-chart functions, and you can find standalone tools as well. I used an Android app called Smith Chart Calc, which you can find at the Google Play store, to solve the Figure 5 matching-network problem. Figure 6 shows the app’s results, with ρ denoting Γ and L and C each expressed as the standard nearest preferred value (NPV).
What else can the Smith chart do?
Many things. We haven’t even mentioned voltage standing wave ratio (VSWR) and its use calculating the impedance of a transmission-line segment terminated by a nonmatching impedance. But that’s a topic for another article.


Leave a Reply
You must be logged in to post a comment.