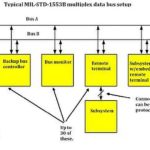
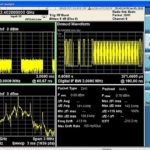
Protocol or bus analyzers (sometimes dubbed packet sniffers) are tools that intercept network traffic, store it, and then decode it for presentation in a human-readable state. Bus analyzers all have the same basic operating principle. They copy all network traffic out to a buffer or file.
A lot of oscilloscopes include bus analyzer features. The first thing on the agenda when working  with such instruments is to view a digital signal in the time domain using a conventional 10:1 analog probe. Look at the tops of logic-high pulses to see if they are reasonably flat. Digital signaling can tolerate a certain degree of noise and the digital content will not be compromised — that is, provided the amplitude of the noise is not high enough to garble the logic transitions. So in taking a preliminary look at an analog display of digital pulses, that is what must be verified. From there, you are ready to bring out digital probes and view multiple digital channels in the logic analyzer section of a contemporary digital oscilloscope.
By way of introduction, we have to consider the difference between a mixed domain oscilloscope (MDO) and a mixed signal oscilloscope (MSO). The Tektronix MSO4000 series oscilloscope is called a mixed signal oscilloscope because it is capable of displaying one signal in the frequency domain while in split-screen format displaying a completely different signal, accessed through a different channel, in the time domain. This is useful in troubleshooting electronic equipment because it lets the user look at a time domain display of (let us say) a power supply while simultaneously viewing a frequency display of an audio output that has intermittant noise or dead spots. That way, the user may be able to infer a causal relationship.
The MDO oscilloscope user can also invoke a split-screen format, in this case, to view simultaneously a time domain and frequency domain display of the same signal. This is also useful in analyzing a signal, but it is limited because two different signals cannot be viewed in different domains. That is the difference between MDO and MSO.
However, here is what is interesting about the Tektronix MDO3000: If you look at the 16-channel digital port at the bottom of the front panel, the dust cover that stays in place when it is not in use says “MSO capable.” And if you press one or more of the analog channel buttons, the instrument goes to split-screen format and 0-V waveforms are shown in their dedicated colors for the active analog channels.

So now you are ready to do some serious digital troubleshooting! Just connect analog probes to the appropriate terminals in the equipment under investigation. All signals, analog and digital, are shown in the same time base.
Just as a digital circuit views a digital signal, a Tektronix MSO or MDO oscilloscope in the digital mode views a digital signal as either high or low, with brief transitions. When a digital circuit has an analog admixture, as in an analog to digital converter (ADC), it can be successfully debugged using the digital facility. Input channel settings are the key. Transistor-transistor logic (TTL) and low-voltage positive emitter-coupled logic (LVPECL) can be simultaneously displayed.
The 16-channel digital probes are subdivided into two 8-channel pods with TTL signals conveyed in one group and LVPECL conveyed in the other group. Then, measuring the threshold voltages will differentiate logic high and logic low pulses.
Like bench-type logic analyzers, the protocol analyzers that are built into MSO and MDO oscilloscopes use two separate and distinct acquisition techniques. These are timing acquisition and state acquisition.
In timing acquisition, the instrument samples the digital signal at a uniform rate dictated by the oscilloscope sample rate. The protocol analyzer conveys to memory the unique logic level. The end product is a timing diagram of the signal under investigation.
In state acquisition, the protocol analyzer ascertains whether a logic state is valid and stable and conveys this information to the user. This is relevant for a synchronous (clocked) signal. A bus display and event table documents this state. In timing acquisition, the logic states are color-coded and time-stamped for the benefit of the user.
To initiate digital acquisition in a Tektronix MSO or MDO oscilloscope, the user must first configure each digital channel threshold for the type of logic involved. Then, if the instrument is to be used in MSO mode with analog channels juxtaposed, those channels have to be skewed to correspond temporally with the digital channels.
One way the protocol analyzer can be used to identify errors in a faulty design is to configure the instrument to trigger on non-conforming pulses, that is, with a pulse width (temporal duration) or pulse height (amplitude) that is outside of specifications. The instrument can be set up to verify a given signal by triggering on non-conforming or missing pulse widths. The single-shot mode freezes the acquisition so that it can be analyzed by the user. Non-conforming pulses can be either greater or less than specified values. These faults can result from design flaws such as improper gating duration.
The instrument can trigger on errors while running overnight, the results available for viewing during work hours. Both analog and digital signal characteristics can be captured and displayed on the same time base.
Multiple protocol analysis functions are tightly integrated in MSO/MDO instruments. The advantage of an oscilloscope with a built-in protocol analyzer is that any of the analog channels can be connected to buses without interfering with the digital displays. The analog waveforms can be displayed in split-screen format with the decoded digital signals. And it does not matter whether the oscilloscope is MSO or MDO. Digital signals can be set up for simultaneous display, triggering and searching.
To decode digital signals, all you have to do is define some digital parameters. First, define the input channels and then set the voltage threshold. The oscilloscope will automatically decode the bus data. A specific bus event can be defined to initiate triggering.
Wave Inspector, the name for a group of controls on the Tek scope front panel, is frequently used in conjunction with analog signals viewed in the time domain. Wave Inspector functions work equally well with the protocol analyzer. The concentric pan and zoom knobs, along with cursers and markers in the analog display, permit the user to take a close look at these signals and to measure parameters to make sure that they are within specifications.
The user can easily search for all instances of various specified events. Wave Inspector is capable of marking events so it is easy to review them later. Because all signals are displayed along the same time base, it is possible to see how the buses relate to one another and to the analog signals as well. All of this information can be viewed also in an event table, with data that is time-stamped to facilitate easy reference and analysis. Data packets can be viewed in binary or hex.
Protocol analyzers are especially relevant in network maintenance and troubleshooting. Lacking a protocol analyzer, the network administrator has to rely on an event log. This is a great thing in itself but only goes so deep. The problem is that the event log describes the problem but does not reveal the cause.

Many protocol analyzers are purely software machines which readily install in a user-supplied PC. Some of them are available for download free of charge. Prominent among them is Wireshark (www.wireshark.org), which works in Windows and Mac. The website has links to numerous videos, webcasts and documentation. Wireshark is highly recommended for new and experienced network administrators.
Riverbed provides funding for Wireshark and is its primary sponsor. Additionally,
Riverbed makes network troubleshooting products that fully integrate with Wireshark. For example, advanced analytics can alert the network administrator to a possible distributed denial-of-service attack, as revealed in bandwidth utilization surges. Other indicators are the addition of new servers or server ports on the network, showing that outside malevolent forces are attempting to gain entry. Then there is a perceptible increase in connections, indicating the presence of a virus.
It takes considerable time to learn to use a bench-type protocol analyzer. A good approach is to connect it to a fully functional network before trouble strikes. Then, when there is a problem, it will stand out.
National Instruments offers a low-cost ($259) protocol educational kit including a hardware module that consists of a detailed study of digital protocols and interfaces for NI’s myRIO RAFA Solutions. It contains exercises for SPI, I2C and UART, and provides an opportunity to deal with real connections and data analysis.


Leave a Reply
You must be logged in to post a comment.