A PC-based oscilloscope, or USB oscilloscope as it is also known, has a lot going for it. For one thing, it costs substantially less than a bench model with equivalent specifications, given that most users already own the major component. The PC or Mac provides the processing and display parts of the equation. (The computer, usually a laptop, also contains the manufacturer-supplied software.) Also, the computer’s relatively large screen is a plus.
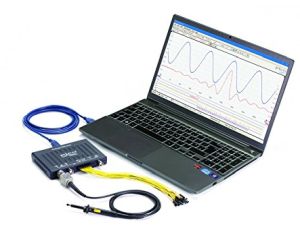
Naturally, there are numerous PC-based oscilloscopes on the market. Some are minimal hobby-grade units with low bandwidth and input voltage levels. At the high end, however, are full-featured laboratory-grade instruments that can probe high-speed electronic equipment and networks, and display, measure and analyze the waveforms.
Picotech offers a range of two- and four-channel PC-based scopes: The 2000 Series models, small in size, have two or four analog channels (16 digital mixed-signal channels) with bandwidths from 10 to 100 MHz. Maximum sampling is 1 GS/sec. Memory is 8 kS to 128 MS. The least expensive model is $115 USD.
The 3000 Series consists of eight-bit general-purpose instruments, all with an internal AWG. These oscilloscopes have two or four analog channels and 16 digital MSO channels. Bandwidths are 50 to 200 MHz with a maximum sampling rate of 1 GS/sec. Memory is 64 MS to 512 MS. Prices start at $579 USD.
The 4000 Series models are equipped with two, four or eight channels, in five to 20 MHz bandwidths. Maximum sampling is 80 MS/sec. Memory is 256 MS. Prices are $819 USD and up.
The PicoScope 5000 Series PC-Based oscilloscopes have two or four channels with 16 MSO digital channels, available in 60 to 200 MHz bandwidths. Maximum sampling is 1 GS/sec. Memory is 128 MS to 512 MS. Prices begin at $1,155 USD.
The PicoScope 6000 Series instrument has four analog channels. Bandwidth is 250 MHz to 1 GHz. Maximum sampling is 5 GS/sec. Memory is 256 MS to 2 GS. Prices begin at $3,295 USD.
The PicoScope 9000 Series are sampling oscilloscopes for analysis of high-speed signals and paths to 16 Gb/sec, with eye diagram, speed and jitter measurement capabilities, plus 9.5 GHz optical inputs, clock recovery and differential TDR and TDT. Models are available with two or four channels at 15 GHz to 25 GHz bandwidth. Maximum sampling is 1 MS/sec. Memory is 32 kS. Prices start at $10,935 USD.
The PicoScope-computer combination is easy to configure and begin using, but there seems to be no end to its features and capabilities. Cabling is simple – just plug the switching power supply into a power outlet and run the supplied USB cable from module to computer. With software from the manufacturer’s website installed in the computer, click on the desktop icon. A user interface appears on the computer screen and it is interactive and responsive to computer mouse and keyboard. Picotech supplies probes with all models. They have BNC connectors that fit the analog channel input ports.
To demonstrate the instrument’s many capabilities and features, the signals provided by the internal waveform generator are suitable. To display these waveforms, run a BNC cable from the port on the module front panel labeled GEN to an analog channel input. Before demonstrating these waveforms, we’ll explore the user interface. Above the display are three horizontal toolbars.
Channel controls are in the bottom toolbar. Here the four (or two) channels are toggled on an off. Adjacent to the channel letters, each in dedicated color, are the on-off buttons, indicating the current status. If you click one of them when it is off, a drop-down menu provides input range options, which set vertical amplitude scaling, immediately shown in the Y-axis. There are 11 options, ranging from 10 mV to ±20 V. Alternately, Auto may be selected. Selecting any one of these options turns the channel on. Then, rather than Off, the vertical scaling appears next to the channel letter in the toolbar.
The other item adjacent to each channel letter in the bottom toolbar is by default dc, and if you click on it, a drop-down menu permits you to change it to ac. This is the Coupling Mode. Most of the time, dc is best, but if you want to eliminate the dc component in a displayed waveform, click ac. This is useful for checking ac ripple in a dc power supply because in the normal dc coupling, the high-amplitude dc signal suppresses the ac signal.
That’s all there is for the channel control toolbar, except for at the far right the signal generator tab. When you click on it, the drop-down menu permits you to configure this function. To turn it on, in the top section of the drop-down menu you have to enable the signal generator. This box also permits the user to set start frequency, amplitude and offset.
Additionally, you can turn on the arbitrary function generator to manufacture custom waveforms. To do this, begin by exploring the arbitrary waveform generator toolbar in the pop-up box. Also, in the signal generator control box, you can choose among the 11 available signals and adjust their frequencies, amplitudes and offsets. To get a stable display, you may have to click Auto Setup in the middle toolbar.
To see the middle toolbar in action, we need to go back to the lower toolbar and make sure that the signal generator is enabled and feeding a signal, such as sine, into an analog channel input, which again in the lower toolbar, is turned on.
The first tab in the middle toolbar, when clicked, causes the instrument to operate in the time domain. Any signal at an active input is displayed with amplitude in volts represented by values on the Y-axis, and time, scaled appropriately to the frequency, represented by values on the X-axis.
The second menu item in the middle toolbar is persistence. This works only in the time domain, not in the frequency domain. The persistence mode shows the analog waveform in cool and hot colors that represent the high-frequency content of a signal at a slow time base. It is used for identifying noise, jitter and glitches.
The third menu item in the middle tool bar places the PicoScope in frequency domain mode, where rather than time, frequency is measured on the X-axis. On the Y-axis, amplitude is represented, but rather than voltage as in the time-domain display, amplitude is shown as power on a default logarithmic scale in decibels or optional linear scale. The frequency domain is a useful mode because it reveals spectral distribution, i.e. the relative power of harmonics at various frequencies. The Fast Fourier mode, unlike the traditional swept-spectrum mode, can display the spectral distribution of a non-periodic signal.
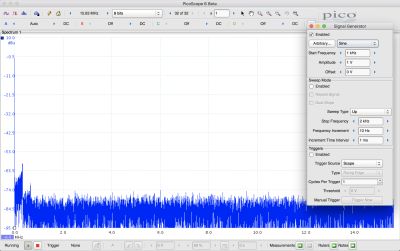
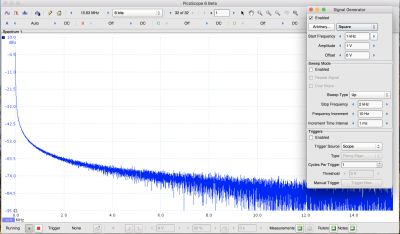
In the drop-down window, the user can configure the frequency domain display, including window functions (Blackman, Gaussian, Triangular, Hamming, Hann, Blackman-Harris, Flat-Top or Rectangular). The vertical scale (logarithmic or linear) and the logarithmic unit may be chosen.
The fifth menu item in the middle toolbar is Auto Setup, which selects the best settings to capture the current signal, much the same as in a conventional bench-type or hand-held oscilloscope.
The sixth menu item in the middle toolbar is Home, which returns the instrument to default settings. The seventh menu item in the middle toolbar is Frequency Range, which may be set from 100 Hz to 60 MHz or more, depending on the model This is similar to Span in a traditional spectrum analyzer.
The eighth menu item in the middle toolbar is Resolution, expressed in bits. The remaining menu items in the middle toolbar are conventional zoom controls, permitting the user to see greater detail in the displayed waveform.
The top menu toolbar resembles the familiar Mac and Windows toolbars that appear across the top of a computer screen when an application is opened. They are contextual, which means that they vary depending upon the program. On the left, by convention, is the computer icon, Windows or Mac. The drop-down menu permits the user to obtain information about the specific computer, set system preferences, force quit a stalled program or shut down, restart or put to sleep the computer.
The second item in the top toolbar bears the name of the application, permits the user to set application preferences, and to quit the application.
In the PicoScope toolbar, File permits the user to connect the module or run the program in Demo Mode (for educational and evaluation purposes when you don’t actually have the PC-Based oscilloscope). Edit allows you to copy an image or text any material that is in the Viewport. Measurements permit the user to add or delete measurements. Tools enables serial decoding.
The PicoScope can decode serial protocols including 1-wire, ARINC 429, CAN and CAN FD, DCC, DMX512, Ethernet 10Base-T and 100Base-TX, FlexRay, I2C, I2S, LIN, PS/2, MODBUS, SENT, SPI, UART, RS-232, RS-422, RS-485 and USB.


Leave a Reply
You must be logged in to post a comment.