By David Herres
The oscilloscope has its roots in nineteenth-century attempts at hand-drawn waveform imaging. The voltage or current of a spinning rotor could be viewed by means of a galvometer and the results plotted on graph paper. A later improvement on this crude process involved attaching a commutator, inspired by dc motor technology. Again the output, based on a mechanical degree indicator scale, had to be hand drawn on graph paper. The waveform was synthesized from thousands of cycles.
These and other first crude attempts at waveform imaging had in common a need for human intervention, and they were overwhelmingly electromechanical in contrast to today’s advanced electronic solutions. Where the human element is part of the picture, there are interpretation and judgment issues. And where there’s a mechanical component present, frequency response gets compromised. Development of lighter components with less inertia made possible higher frequency response, but there were relatively low upper limits to what could be observed and recorded with any kind of mechanical system.
Successive improvements included photographic and tilting mirror innovations. These led to waveform recording with a frequency response of about 10 kHz. But the time base remained unsynchronized.
A great breakthrough came with the development of the cathode ray tube (CRT) in the late 19th century. At first it was merely an intellectual and educational tool confined to the laboratory. CRT technology eventually made possible the first oscilloscope that was a diagnostic as well as developmental tool. The signal to be displayed was applied to the vertical deflection plates and an externally- and later internally-generated ramp wave was applied to the horizontal deflection plates, providing the time base.
The problem remained of creating a stable display based on a continuous uniform wave. A screen of infinite width could reproduce a continuous wave but that, of course, was not possible. , it was necessary to return the beam to one side, by convention the left side, and continuing where it had left off. When this was attempted, the result was either a meaningless blur of light or a rapid horizontal displacement of the waveform that could not be stabilized. What remained was a way to stabilize the display by synchronizing the time base to the signal.
While early oscilloscopes were able to display repetitive and continuous electrical data, they were limited insofar as they could not perform quantitative measurements and capture transient events. In 1947 Howard Vollum, the great motivating force and key figure in the founding and early development of Tektronix, introduced the first commercially available triggered-sweep oscilloscope. It had a calibrated graticule display, permitting accurate voltage and timing measurements on a full range of signals. As with modern scopes, a trigger event, inherent or defined by the user, established a precise point in time, rapidly repeating, at which the display commenced. Identical waveforms coincided and merged to form a coherent image.
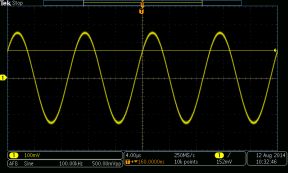
The Tektronix MDO3014, like many other models, has a section on the front panel that is marked Trigger. The triggering voltage can be controlled by the knob labeled Level. The level is indicated by the small arrow on the right of the display. If you change the level, a horizontal line (shown in the first figure) indicating the voltage level crosses the display, disappearing after a couple seconds.

Moving the trigger level above or below the waveform eliminates the triggering event and the waveform becomes unstable (visible in the second figure). At this point the oscilloscope no longer embodies Howard Vollum’s groundbreaking innovation introduced in the Tektronix Model 511 oscilloscope.

Leave a Reply
You must be logged in to post a comment.