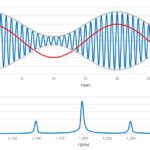
A mixer can upconvert and downconvert a modulated signal with no loss of baseband information. Part 1 of this series described intermodulation resulting from the combining of two or more sinusoidal signals through a nonlinear device such as the mixer in Figure 1. The mixer’s output is the product of its two inputs, and its […]
FAQ
What is intermodulation, and is it good or bad? Part 1
Sinusoidal inputs applied to a nonlinear system produce an output containing different frequencies, and the results can be good, bad, or ugly. According to the dictionary definition, intermodulation is “the production in an electrical device of currents having frequencies equal to the sums and differences of frequencies supplied to the device.” In the literature of […]
Why does the Fourier transform provide apparently inaccurate results, and what can I do about it? Part 4
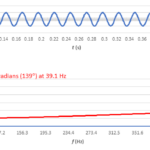
The FFT can measure phase angle, but what appears to be a meaningful result might just be the arctangent of a ratio of rounding errors. Throughout this series, we reviewed the fast Fourier transform (FFT) as implemented in Microsoft Excel and investigated windowing functions. In this final part, we’ll cover phase measurements, but first, let’s […]
How to separate differential and common-mode harmonic noise currents
Differential-mode and common-mode currents can cause your product to produce radiated and conducted emissions. These three techniques can help you measure them.
Why does the Fourier transform provide apparently inaccurate results, and what can I do about it? part 3
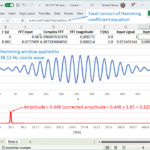
Windowing functions account for mismatches between an input signal and FFT sample size. We concluded part 2 of this series with a look at fast Fourier transforms (FFTs) of 39.1-Hz and 38.12-Hz cosine waves, with our sample size N = 512 and our sample interval Δt = 1 ms (Figure 1). Shouldn’t the amplitudes of […]
Why does the Fourier transform provide apparently inaccurate results, and what can I do about it? part 2
A bare-bones implementation of the Fast Fourier Transform helps illuminate how to extract frequency information from input data samples. In part 1 of this series, we reviewed the discrete Fourier transform (DFT) and manually calculated one DFT shown in Table 1. Table 1. Manual DFT results DFT input Complex DFT |DFT| 3 12 + j0 […]
Review: Electronic bug and hidden camera detectors
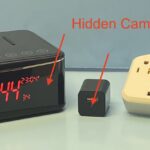
Do you want assurance that cameras embedded in everyday devices don’t spy on you? Then you should check for cameras, SD card slots, and Wi-Fi-connections. We reviewed two devices that help you find those lurking spies. While discovering a hidden camera in an Airbnb, VRBO, or hotel is rare, there have been reports of travelers […]
Why does the Fourier Transform provide apparently inaccurate results, and what can I do about it? part 1
This multipart series will review the discrete Fourier Transform and describe how to avoid common problems when transitioning from the time to frequency domain. A recent post on phase noise discussed expressing a function of time as a function of frequency. The Fourier Transform is the well-known road from the time domain to the frequency […]
How to use remote sensing for DC programmable power supplies
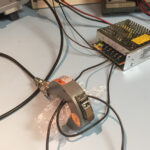
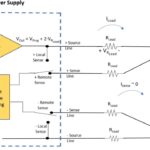
In this FAQ, you’ll learn how to know if your test application needs sensing and how to properly wire a power supply to a load. Calibrating certain sensing circuits, such as those used in electric vehicles (EVs), is critical to get right. An inaccurate calibration of an automotive battery monitoring circuit could, for example, allow […]
What is phase noise and how can I measure it? part 2
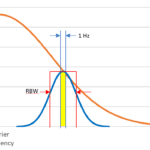
Phase noise requires more than one instrument unless you use a phase-noise analyzer.
