The most common use of an oscilloscope is to display one or more signals in the time domain. A variation is the display of signals in the frequency domain. In most oscilloscopes that have this capability, the frequency domain is accessed by pressing a button labeled Math. Then, press the soft key, a control that varies with the context, corresponding to Fast Fourier Transform. The display instantly changes to show the same connected signal in the frequency domain. As in the time domain, the Y-axis corresponds to amplitude, but it is calibrated in terms of power amplitude rather than a voltage amplitude. The display is usually on a logarithmic scale.
What is radically different in the frequency domain mode is that a totally different use is made of the X-axis. Rather than time, it is set up to show frequency. The frequency domain representation consists of precisely the same information as the time domain representation, and it is possible through the miracle of the Fourier Transform and the Fast Fourier Transform derived from it, to go from one domain to the other any number of times with no loss of information.
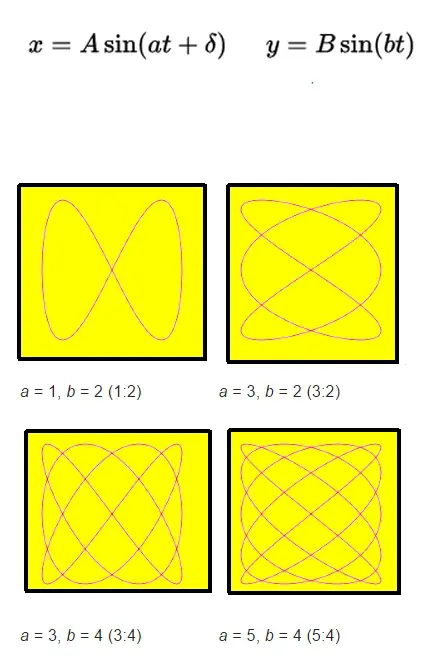
Another type of oscilloscope display mode is known as the XY mode. Two signals are fed into separate channels. One signal is applied to the vertical system as in the usual time domain hookup. When the oscilloscope is operating in the XY mode and a second, synchronous signal is fed into a different channel as specified on the scope, both signals trace out voltages, one on the X-axis, and as if the waveform were turned sideways, the other on the Y-axis. The resultant image is known as a Lissajous pattern. By examining the Lissajous pattern, certain information about the relationship between the two signals becomes clear. The metrics of interest are frequency, ratio, relative amplitude and phase shift.
The simplest Lissajous patterns appear in the oscilloscope display when the frequencies of the signals are the same, i.e. their ratio is 1:1. When this condition is met and when the phase shift is 0°, the display consists of a straight line sloping upward from the left side of the screen to the right side. The same Lissajous pattern is displayed when the phase shift is 360°, illustrating that these two phase shifts are equivalent.
When the phase shift is 90° or 270°, and both signals are the same frequency, a perfect circle displays. When the phase shift is 45°, the Lissajous pattern is an ellipse whose centerline slopes upward from left to right. When the phase shift in 180°, the Lissajous pattern is a straight line sloping down from left to right.
In all cases when the frequency ratio is 1:1, what displays is an ellipse, of which the straight line and circle are limiting cases.
Increasingly complex but easily recognizable Lissajous patterns are obtained for these phase shifts of two signals having different frequency ratios, and when the amplitudes are not the same, still more Lissajous patterns are generated.
Lissajous patterns get their name from Jules Antoine Lissajous, who investigated, wrote and lectured about them in 1857. He was a prominent and successful lecturer, demonstrating a device he built which generated these patterns. It consisted of a vibrating tuning fork to which a mirror was attached. Light reflected from this mirror and then, in turn, reflected from another mirror attached to a second tuning fork. These two assemblies mounted at right angles and the image was projected onto a wall in a darkened room.
Today this nineteenth-century demonstration is accomplished by connecting an external or internal signal to two oscilloscope channels. The difficult part is finding a source of two ac signals that are synchronized. Obviously, a suitable function generator will work. But there are other alternatives.
A hand-held, battery-powered oscilloscope with at least two channels insulated from ground and from each other can connect to the utility supply in such a way as to obtain two ac signals that are either in phase or 180° out of phase. The out-of-phase signals are obtained by connecting two probes such that their ground return leads connect to opposite sides of the utility supply circuit.
Note this scheme cannot use a bench-type grounded oscilloscope with ordinary probes because there will be an intense fault current. A differential probe solves the problem but is a fairly expensive accessory, so most labs don’t have one.
There is, however, another way. The Tektronix MDO3000 series oscilloscope with an internal arbitrary function generator can generate 13 different waveforms:
- Sine
- Square
- Pulse
- Ramp
- DC
- Noise
- Sin (x)/x
- Gaussian
- Lorentz
- Exponential Rise
- Exponential Decay
- Haversine
- Cardiac
The default waveform is sine, which is what we want. It can be displayed by running a BNC cable from AFG Out, which is on the back panel, to one of the analog channels on the front panel. Channel One is the default selection. The plan is to input two sine waves into separate channels, with the capability of changing amplitude and frequency, and to view the Lissajous pattern in the scope’s XY mode.
To see this in the MDO 3000 series instrument, first press Default Setup. Then press AFG. The default sine wave appears in the display. Then press the Save/Recall Menu button. Set the source as Channel One, using Multipurpose Knob a. Set the destination as desired, taking care not to overwrite a previously saved signal that you want to retain. Then, press OK Save.
You can tell that the sine wave from the AFG has been successfully saved when the color of the trace changes to white, which is not one of the dedicated channel colors.
To access the Lissajous image, press Acquire. Then press the softkey associated with XY display. The menu appears to the right of the display, and XY Display is currently off. Press Triggered XY, which turns on the XY mode. The XY display is a horizontal line.
Notice that if you turn off AFG or disconnect the BNC cable, the Lissajous pattern temporarily goes away. Pressing AFG, then Waveform Settings, it is possible to alter the frequency or period, amplitude and offset and watch what happens in the XY display.
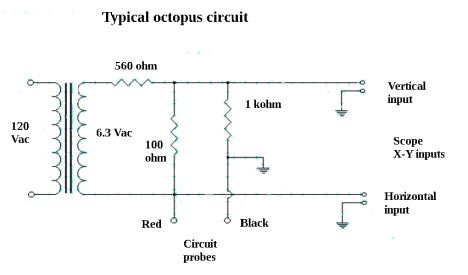
Lissajous patterns are interesting and instructive, but one might ask about their practical use. In conjunction with the oscilloscope, a device known as the octopus tester can be used to test circuits to see if they are open or short. The integrity of a resistor, capacitor, inductor or diode (including Zener) can be tested.
A horizontal line corresponds to an open circuit. A vertical line corresponds to a short. A slanted line going from the lower left to the upper right is displayed when the device hooked to the octopus tester is a resistor. An ellipse signifies a capacitor or inductor. A backward L is a diode, and if there is a downward going vertical line added, you have a Zener diode.
The device connects a current-limited voltage to the component or circuit of interest. Voltage and current are plotted in the display of an oscilloscope operating in XY mode, and the Lissajous patterns convey information to the user regarding the status of the device or circuit. Using probes, you can quickly move around large amounts of complex circuitry with many components and get a good idea of what is going on.

Quote of the month:
“..because there will be an intense fault current…”
I’m interested in getting the Lissajous figures to display the result of a sine-wave on one input and a sung tone through a microphone on the other. I did this in college as part of research on pitch-matching…but that was in 1980, and I’ve forgotten all the details.
My current ‘scope is an old Hitachi V-302. I have sine-wave generator, mics, mixing board, preamps…but damned if I can remember how to set the darned things up.
Any advice for the technologically-challenged?
Most decent scopes have an invert function for channel 2. This is a simple way to avoid the “intense fault current”.
The “one” device that identified a defective hysteresis transformer in and out of circuit. An available “good” part is helpful. An audio generated steady signal can usually function better in lieu of the transformer.