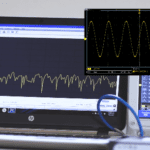
Modern bench-type and even hand-held oscilloscopes have spectrum analysis capability, providing great added versatility. They can view in rapid succession (or even simultaneously in split-screen format in a mixed-domain instrument) time domain and frequency domain displays of the same signal.
Fourier theory tells us that any signal or function in the time domain can be decomposed into an aggregate of sine waves in the frequency domain that is an exact equivalent. This process is known as Fourier analysis. Its counterpart is Fourier synthesis, wherein these separate sine waves at different frequencies can be recombined to form the original function of time notwithstanding its complexity.
 This is a two-way process, so we can go back and forth between time and frequency domains as many times as desired with no loss of information. The only problem is that the mathematics is enormously complex. For many years following Joseph Fourier’s explication in The Analytic Theory of Heat (1822), the complex mathematical computations required to perform the Fourier Transform made the process accessible only to advanced researchers and theoreticians.
Then, beginning in 1805 and finally entering the mainstream in 1965, the Fast Fourier Transform (FFT) became widely known, at least in the test and measurement community.
FFT is a constellation of algorithms whereby the Fourier Transform can be computed simply and quickly by a desktop computer or bench oscilloscope merely by pressing one or two buttons. The way it works is by factorizing the Discrete Fourier Transform (DFT) matrix into a sparser product. A DFT matrix is an expression of any discrete Fourier transformation matrix that can be applied to a function by means of matrix multiplication. The FFT permits the oscilloscope to display signals in the frequency domain and that capability is useful for general analysis of circuit behavior. But when it comes to network monitoring and also detecting and quantifying spurious emissions, there are compelling reasons for deploying a spectrum analyzer despite its significantly heftier price tag.
The spectrum analyzer is less versatile than the oscilloscope. It displays a frequency domain representation of the signal applied at its single input – the time domain representation is not present. But within the frequency domain there are numerous features and advanced specifications that exceed oscilloscope capabilities. That is why compared to the oscilloscope the spectrum analyzer requires more capital and user knowledge and expertise.
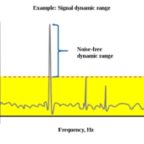
By analyzing the spectrum of an electrical signal, frequency, power, distortion, harmonics, bandwidth and other characteristics of a signal can be observed. These aspects are present in a time domain display, but they are difficult if not impossible to interpret without resort to the frequency domain representation.
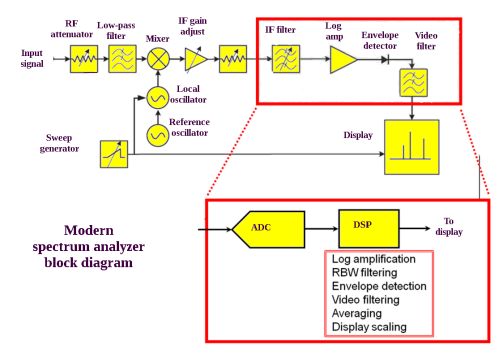
Traditionally, the spectrum analyzer was strictly a swept-spectrum instrument. It made use of superheterodyne architecture, invented in 1918 and employed in most radio and TV receivers since, including the latest models. The basic concept is simple and effective. An amplitude or frequency modulated carrier wave from the transmitter causes current to flow in the receiver antenna. In the tuner, a variable capacitor or electronic tuning circuitry singles out the desired frequency, and this modulated RF signal is amplified and conveyed to a mixer, which is also connected to a local (in receiver) oscillator.
In the mixer, the RF signal and oscillator signal beat against one another so sum and difference signals are produced. A band-pass filter selects the lower or intermediate frequency (IF), intermediate because it is lower than the RF signal and higher than the final audio frequency (AF). Besides being lower than the RF signal, the IF signal, a carrier still modulated, has the property that it is always the same, regardless of the differing RF signals that are selected in the tuner. This is because (prior to electronic tuning) a two-gang variable capacitor, two devices on a single shaft, separately tuned the RF signal in order to select the desired broadcast and also adjusted the local oscillator output so that the IF remained constant. This greatly simplified IF amplification stages, which also operated more efficiently at the lower, more manageable frequency. Subsequently, a detector demodulated the IF carrier so as to realize an AF that could drive the speaker at audible frequencies.
The swept-spectrum (also called sweep-tuned and swept-tuned) spectrum analyzer came first and for a long time was the only instrument of its kind. Like the superheterodyne radio receiver, it has a local oscillator that produces a beat frequency. The object is not radio reception, but rather to create a frequency domain display of the signal of interest. The instrument uses superheterodyne technology to down-convert some of the signal spectrum at the input to the center frequency as determined by the band-pass filter. This is accomplished by sweeping the output of a voltage-controlled oscillator through a range of frequencies that is determined by the user.
A key parameter is resolution bandwidth, the minimum bandwidth that the instrument can display. A swept-spectrum analyzer set to smaller bandwidth achieves greater spectral resolution. The amount of frequency resolution varies with signal update speed. We need to look closely at this relationship when the task is to distinguish nearby frequency components.
When displaying low-amplitude signals in a swept spectrum analyzer, pre-amplification is needed. This may result in misleading harmonic and inter-modulation distortion and unintended imaging in the display. The swept-spectrum instrument brought Fourier analysis to the lab bench, but display limitations due to the trade-off between update speed and frequency resolution placed limits on its usefulness in signal analysis as required for troubleshooting and prototype evaluation.
Because of these limitations, attention has shifted to the FFT-based spectrum analyzer. Rather than sweeping the frequency span, it performs a digital sampling operation at a rate that is twice the frequency of the signal at the input, in order to comply with the Nyquist criterion.
In an FFT-based spectrum analyzer, the signal first goes to an analog to digital converter (ADC). The receiver selects a portion of the input in terms of frequency, but unlike in the original instrument, this product is not swept. The receiver reduces the required sampling rate so that the instrument can process the entire range of samples. The object of all this is to avoid missing the short duration events that are being investigated.
The wave of the future in spectral analysis is the real-time spectrum analyzer. It succeeds in displaying dynamic as well as transient RF signals as required to assure equipment compliance. These instruments can trigger on specific RF signals, placing them in memory so that they are available for analysis in time and frequency domains.
A real-time spectrum analyzer front end can look across the instrument’s available spectrum. Then, it constrains the signal to an unvarying IF that corresponds to the real-time instrument’s available bandwidth. Following digitization, the signal is subjected to triggering, placed in memory and analyzed.
The user can interact with a real-time spectrum analyzer to capture and interpret transient effects that may not be visible in other forms of these instruments. That is because they have an extremely fast processing engine that is able to process the entire bandwidth without gaps. The ADC is similarly able to digitize the entire bandwidth within the acquired passband. Also, there is sufficient memory to enable ongoing acquisition over the entire measurement period.
The real-time spectrum analyzer provides triggering that is not subject to delay, and it provides continuous signal capture and cross-domain analysis. Low noise and high dynamic range are capabilities in today’s ADC implementation, making all of this feasible. The bottom line is that real-time spectrum analysis offers superb performance for those who can afford the price.

Tektronix has significantly reduced the cost to own a real-time spectrum analyzer by developing the RSA306 PC-Based Spectrum Analyzer. It consists of a simple module cabled to a user-supplied PC. Power and data are conveyed between these units by means of a USB 3.0 cable. The module has no external controls, moving parts or internal contacts. A ruggedized enclosure is suitable for outdoors or on the factory floor.
The reduced cost is a consequence of the fact that the PC, typically a laptop, is not included, the assumption being that the user already owns or has access to this platform. (Tektronix engineers have successfully connected the RSA306 to a Mac, using Apple-supplied BootCamp which permits cross-platform operation.) The key ingredient in this mix is SignalVu-PC, an application provided by Tektronix on an included flash drive or as a free download from the vendor’s website. It allows the PC to process and display signals from the module.


Leave a Reply
You must be logged in to post a comment.