
Interference in the 900 MHz band appears to produce random errors in a gas station price sign. Spectrum analyzers help track it down. I received a call recently from a former client who manufactures electronic signs. A gas station was experiencing intermittent loss of wireless control of its signs, which displayed the price of various […]
spectrum analyzer
Why does the Fourier transform provide apparently inaccurate results, and what can I do about it? Part 4
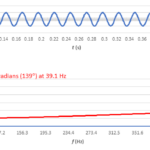
The FFT can measure phase angle, but what appears to be a meaningful result might just be the arctangent of a ratio of rounding errors. Throughout this series, we reviewed the fast Fourier transform (FFT) as implemented in Microsoft Excel and investigated windowing functions. In this final part, we’ll cover phase measurements, but first, let’s […]
How to separate differential and common-mode harmonic noise currents
Differential-mode and common-mode currents can cause your product to produce radiated and conducted emissions. These three techniques can help you measure them.
Wi-Fi 7 approaches, now comes the testing
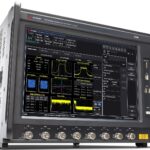
Keysight’s E7515W lets you test Wi-Fi 7 chipsets and systems.
What is phase noise and how can I measure it? part 2
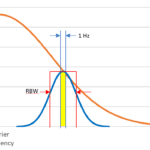
Phase noise requires more than one instrument unless you use a phase-noise analyzer.
AOC 2023: Exhibits show the latest in military wireless
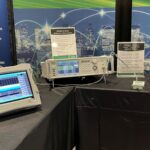
Washington — The Association of Old Crows (AOC) held its 60th annual convention in Washington during the week of December 11, 2023. EE World was there on December 12. Here is some of what we saw in the exhibit hall. AOC is a defense-oriented conference that focuses on military wireless communications. In addition to product […]
TinySA Ultra: A low-cost spectrum analyzer that fits in your pocket

This palm-sized, battery operated instrument can help you diagnose EMC problems.
How to use simple antennas for EMI troubleshooting
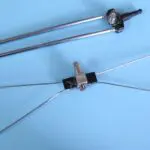
For general troubleshooting, you can use consumer-grade antennas such as for TV. Pre-compliance tests require calibrated antennas. Antennas are important for capturing radiated harmonic emissions from electronic products. You can use them for simple troubleshooting or for calibrated pre-compliance testing. For troubleshooting purposes, you can use almost any uncalibrated antenna. I’ve even seen engineers use […]
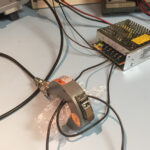
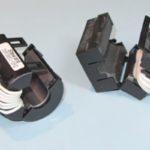
How to use RF current probes for EMI: Part 2
In Part 2, you will learn how to use an RF current probe to calculate E-fields and troubleshoot EMI emissions from cables. Free and low-cost software tools let you customize the calculations based on your current probe’s data. As I mentioned in Part 1, RF current probes are one of my most useful troubleshooting tools. […]
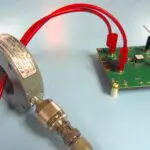
How to use RF current probes for EMI: Part 1
DIY and commercial RF current probes let you find which cables act as EMI-emitting antennas. RF current probes are one of my most useful troubleshooting tools. Because most radiated emissions failures are due to attached cables acting as transmitting antennas, clamping an RF current probe around a wire or cable will measure the common mode […]
