Light has varying definitions; it’s usually limited to the visible portion of the electromagnetic spectrum, but sometimes it’s defined to include the near-infrared (IR) and ultraviolet (UV) portions. For example, LidAR (light detection and ranging) uses various portions of UV, visible, or near IR spectrum to image objects. And ‘light’ has a different definition if you’re a person or a plant. This FAQ begins with a review of the basic physical properties of light, considers absolute and subjective ways to measure light, and looks at applications of light in product design, displays, horticulture, and LiDAR.
Light has several important properties: Light is directional and spectral; Light consists of waves and particles (photons), and; Light has a fixed speed. Useful light measurements can be in absolute physical units or subjective and relative quantities. Both types of measurements can be useful to electronic system designers.
The visible light spectrum is a small portion of the overall electromagnetic spectrum (Figure 1). It’s typically defined as 400 to 700 nanometers (nm) wavelengths. Moving across the spectrum can start with 445 nm, which corresponds to blue light, move to 535 nm, corresponding to green light, up to 570 nm, corresponding to yellow light, and red light at 650 nm. In a broader context, light is sometimes considered electromagnetic radiation in the frequency range between 3 x 10¹¹ Hz and 3 x 10¹⁶ Hz, which corresponds approximately to wavelengths between 10 nm and 1 mm and includes the UV, visible, and IR regions.

Measuring light
Radiometry is the measurement of optical radiation. The five most commonly used radiometric measurements include:
- Radiant Energy is energy of light. Its SI unit is the joule (J)
- Radiant Flux is radiant energy per unit time (also called Radiant Power). Its SI unit is the Watt (W)
- Irradiance is radiant flux incident on a surface unit area. Its SI unit is W/m2.
- Radiant Intensity is radiant flux emitted from a point source per unit solid angle. Its SI unit is: watt per steradian (W/sr)
- Radiance is radiant flux emitted from an extended source per unit solid angle and per unit projected source area. Its SI unit is: watt per steradian and square meter (W/(sr m2))
Light can also be measured subjectively based on the human eye’s response. For each radiometric quantity, there is a corresponding photometric quantity evaluated according to the human eye’s sensitivity to various wavelengths of light. While radiometry focuses on measuring radiant energy in terms of absolute power, photometry considers the human eye’s response. It focuses on measuring light in terms of perception (Figure 2).
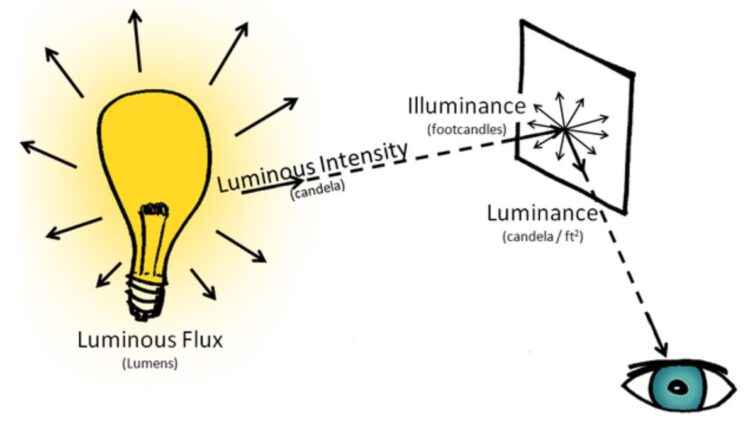
Common photometric measurements are:
- Luminous flux is measured in lumens (lm). The lumen is an SI unit derived from the candela
- Luminous intensity is measured in lumens/steradian (lm/sr), equivalent to candela (cd)
- Luminance is measured in candela/square meter (cd/m2) and is equivalent to a nit
- Luminous efficacy measures how effectively the eye converts radiant flux into a visual sensation and is measured in lumens/watt (lm/W)
- Illuminance is measured in lumen/square meter (lm/m2) and is equivalent to a lux.
Bi-directional Reflectance Distribution Function
Advanced optical technologies such as semiconductor lithography, nanostructured functional surfaces for consumer optics, and advanced optical systems for astronomy rely upon improvements in the optical qualities of materials, surfaces, and components. Improvements in optical technologies often require improved analysis methodologies to assess a material’s optical characteristics.
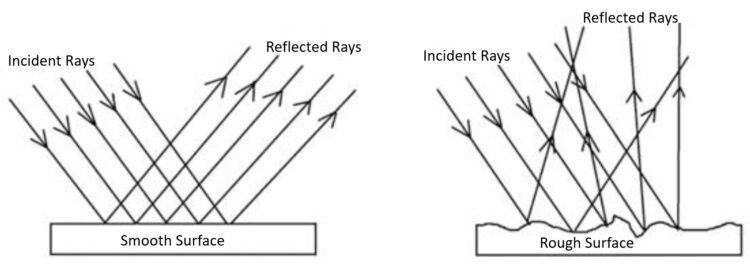
For example, light scattering measurements are one tool that can provide information about overall appearance, including color, shine, and texture. And these measurements are used is to quantify product appearance qualities such as:
- Color can be analyzed using the spectral distribution of reflected light from a material
- Texture arises from the spatial distribution of reflected light from a material
- Shine is related to the geometric distribution of reflected light from a material
The bidirectional reflectance distribution function (BRDF) is a physical quantity that integrates information related to color, shine, and texture (Figure 3). A BRDF can establish correlations between physical quantities and an observer’s response obtained by visual measurements.
Nits, contrast, and HDR for displays and TVs
Traditionally, the performance of displays has been measured using pixel densities, nits, and contrast ratios (CRs). Those are all useful metrics; pixel densities measure resolution, nits measure the overall brightness of a display, and the CR defines the ratio of the luminance of the brightest shade of white to the darkest shade of black that a display can produce.
CR measurements are not nearly as standardized as are pixel densities (e.g., 4K and 8K) or nits. As a result, the CRs measured for displays from different sources are often not comparable. The most common CR measurements are for static environments where the image is not moving. Display and TV makers usually measure CR in isolation from the environment. Designers and scientists often prefer to take the effect of the environment (room) into account. An ‘ideal room’ absorbs all the light from the display, and the only light seen in the room would be from the display. In this environment, the CR of the image would be the same as the CR of the display. In an actual room, some of the light emitted by the display is reflected by the display, reducing the effective CR.
In addition to the challenges associated with viewing a display in an actual room, there are differences between static CR and dynamic CR. When the picture moves, it changes slightly from moment to moment, and that dynamic picture complicates the definition of CR. The concept of high dynamic range (HDR) has been developed to address that concern. HDR is sometimes referred to as wide dynamic range, extended dynamic range, or expanded dynamic range.
TVs and other displays need to have a higher maximum brightness to produce an HDR output. Non-HDR TVs have outputs of 100 to 200 nits. HDR TVs have outputs from 400 to 2,000 nits. And to address the need for standardization of HDR, the Ultra HD Alliance has developed certification requirements for an HDR display. To qualify as HDR, a display must have either a peak brightness of over 540 nits and a black level less than 0.0005 nits (a contrast ratio of at least 1,080,000:1, or a peak brightness of over 1000 nits and a black level less than 0.05 nits (a contrast ratio of at least 20,000:1). The two options are designed to consider the differences in display technologies such as LCD and OLED.
Light for plants
The definitions of lumens and lux were developed based on the spectral sensitivity of the human eye. Plants have different spectral sensitivity and can use more of the wavelengths between 400 and 700 nm for photosynthesis. The photosynthetically active radiation (PAR) model was developed specifically for horticultural lighting applications (Figure 4).
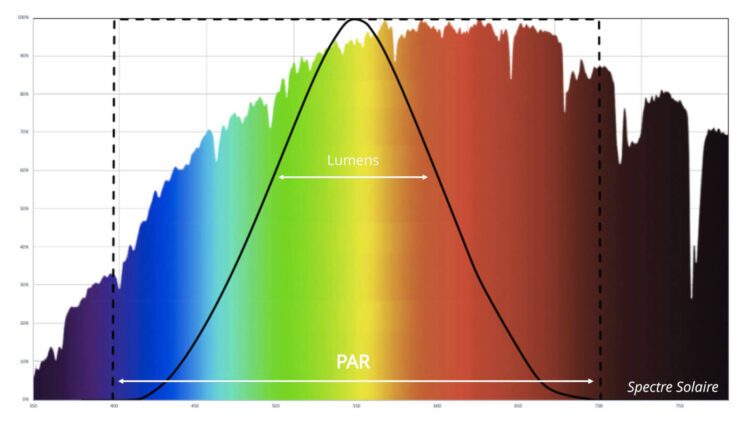
Since plants are more sensitive to blue and red than the human eye, conventional lumens and lux cannot accurately measure light in greenhouses or farmland. PAR measurements are used in forestry and oceanography, in addition to agriculture. PAR is used to evaluate potential agricultural investments, and it’s used in forestry with sensors positioned at various levels in the forest canopy to measure the variations in PAR utilization and availability. PAR measurements are also used to calculate the euphotic depth in the ocean or lakes. The euphotic depth is the maximum depth at which net photosynthesis happens, typically a light intensity of about 1% at the surface.
In addition to the different spectral sensitivities of plants, photosynthesis is a quantum process. It is less dependent on the energy of the photons than it is on the number of photons. Plant biologists typically quantify PAR in terms of the photosynthetic photon flux density (PPFD) that measures the number of photons between 400 and 700 nm received by a surface for a given amount of time. PPDF values are usually expressed in terms of mols of photons per square meter per second.
While PPFD is a useful snapshot of photosynthetic light density, the daily light integral (DLI) can be an even better tool. The DLI provides a longer-term measurement of the daily flux of photons per ground area, including both diurnal variations and variation in day length. It is often presented as a day-by-day measurement to describe the suitability of the light environment for photosynthesis.
LiDAR for cars and mobile phones
While all of the applications discussed above focus on radiant energy and spectral qualities of light, LiDAR uses light’s speed and its small wavelengths. LiDAR can use ultraviolet, visible, or near-infrared light to image objects. With a narrow beam, it can produce high-resolution maps of physical features. The speed of light is used by LiDAR to determine the distance of objects in a method called time of flight (TOF). It can also estimate the speed and direction of motion for objects. One emerging application of LiDAR is in autonomous driving systems, where LiDAR can support various levels of vehicle automation.
The iPhone 12 Pro, iPhone 12 Pro Max, and the iPad Pro include LiDAR, but no app is included in the basic devices. LiDAR is used by existing apps to start augmented reality applications faster and to quickly build a map of the surroundings to add more detail. And, there’s an app called “Canvas: LiDAR 3D Measurements” free on the iOS App Store that can be used to scan a room. The user stands in the middle of the room, taps the Measure-like controls, and then slowly turns around. The LiDAR sensors can produce high-resolution models of small objects with a side length > 10 cm with an absolute accuracy of ±1 cm.
Summary
Light is an important phenomenon used across various applications, from displays to farming and augmented reality. Measuring light can be done in absolute values or relative values optimized for specific environments, such as the range of light perceived by human eyes or the larger range used by plants for photosynthesis.
References
How Light Scattering Measurements Can Improve Your Optical Product Development, Synopsys
How is the Brightness of Light Determined?, Lumitex
How to use the LiDAR scanner in iPhone 12 Pro, appleinsider
Photosynthetically active radiation, Wikipedia
The Perception of Light by the Plant and the Human Eye, RED Horticulture
The Ultimate Guide to Light Measurement, Lumitex

Leave a Reply
You must be logged in to post a comment.