This FAQ looks at software that can synchronize multiple oscilloscopes, perform mathematical functions, and transform a basic USB oscilloscope into multiple instruments.
A USB oscilloscope consists of signal capture and conditioning electronics, a personal computer (PC) that can be a laptop, tablet, or desktop, plus PC software. The availability of application specialist software is a key differentiator between various USB oscilloscopes. Part 1 reviewed the protocol analyzer, logic analyzer, arbitrary waveform generation, and user-defined USB oscilloscope software.
USB scopes are available with multiple channels. When more channels are needed multi-channel software can be used to link multiple units into a single instrument with as many as 64 channels. Some units require a coupling connector to link the various units; in other cases, each instrument must be connected to a separate USB port. In all cases, the computing power and memory of the PC can be a performance limiting factor for large numbers of channels.
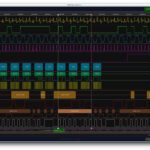
The PC software for many USB oscilloscopes includes a wide range of mathematical functions that you can perform on waveforms including addition, subtraction, multiplication, division, integration, differentiation, finding square roots and logarithms, and more. The mathematical functions can be used in combination supporting more complex analytical needs. Depending on the software design, the results can be displayed in multiple graphs, as numeric values in tables, and can be written to memory in a variety of file formats and exported for use in other platforms like MATLAB (Figure 1).

Spectrum analyzer
Used as a spectrum analyzer, a USB oscilloscope can graphically display amplitudes versus frequency illustrating the relative signal strength of various frequency components in a signal. Spectrum analyzer software is better suited for identifying small harmonic distortions on a signal compared with an oscilloscope that operates in the time domain. In addition, operation in the frequency domain makes it simple to determine the carrier frequency and the modulation frequency, level, and distortion of amplitude-modulated (AM) or frequency-modulated (FM) signals.
Data logger
Data-logger software enables a USB oscilloscope to display the voltages of two or more signals plotted against time. Data loggers can be especially useful in specific circumstances such as measuring long and non-repetitive signals like those used for serial communications protocols that are too long to capture in the standard internal memory. Data loggers are also useful for capturing slowly changing signals such as temperature changes in a room. The software can be set to send alerts if the signal variation exceeds programmed trigger levels.
Multimeter
Multimeter software is used to measure and monitor specific signal characteristics like the root mean square (rms) voltage, frequency, maximum voltage or current, minimum voltage or current, and so on. Applications include setting a DC offset voltage to zero, monitoring power consumption, and analyzing power quality parameters of AC power systems. Multimeter software is available that can display the measurements in a table format or on a virtual gauge (Figure 2). In addition to displaying the values, the gauge can include visual indications of excessive or dangerous values.

Summary
Software lets you combine multiple USB oscilloscopes into a single instrument with a high number of channels for complex applications. USB oscilloscopes are also capable of performing a wide range of mathematical operations on signals. The software can transform a single USB oscilloscope into multiple instruments.
References
Combining several oscilloscopes, Pico Technology
Mathematical Functions, T&M Atlantic
Multi-channel Oscilloscope Software, TiePie Engineering


Leave a Reply
You must be logged in to post a comment.