Where there is matter, there is the potential for free electrons, and unless the temperature is absolute zero, these electrons exhibit random motion. Thus the basis for noise in electronic circuits. In metals such as copper, the number of these free electrons is large and their motion appears to be independent and truly random.
Electronics students are generally surprised to learn that a small voltage can be measured across an out-of-circuit resistor. Placing it in parallel with a load or shunting the leads makes a minute amount of current flow. The central limit theorem in statistics states that the incredibly rapid variations in the rate of current flow will inevitably conform to a pattern known as the Gaussian Probability Density Function. In a measuring instrument such as an oscilloscope, this random energy is visible to a greater or lesser degree depending on ambient temperature and heat generated within the instrument and in the circuit under investigation. In the instrumentation, the random electrical energy appears as the noise floor.
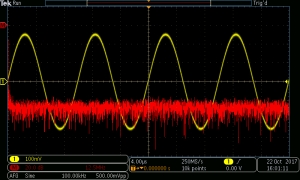
This interesting phenomenon takes different forms depending on how the acquisition is configured. Operating in the time domain, a signal (or function, which is the same thing considered from the mathematician’s perspective) is displayed as a curve or graph where amplitude on the Y-axis is plotted against time on the X-axis. The noise floor is present in the form of a blurring or thickening of the trace. If the scale is altered so as to magnify random fluctuations in amplitude, the waveform is seen to exhibit variations or a wiggling behavior that does not conform to the abstract function.
In the frequency domain, the noise floor is apparent, and we see it in its classic form. Amplitude in the frequency domain is plotted (usually logarithmically, in decibels rather than volts) as power along the Y-axis, and frequency rather than time is plotted along the X-axis. This is another rendering of the same signal. The fundamental appears as a spike at a single frequency. If the signal is not a pure sine wave, additional spikes will appear, the amplitude diminishing farther in frequency from the fundamental.
The noise floor in the frequency domain takes the form of a continuous irregular line varying in a non-periodic fashion. Decreasing in amplitude, the harmonics soon disappear below the noise floor, which places a limit on measurements that can be made with the oscilloscope or in fact with any test instrument.
One thing to note about the noise floor is that there are no gaps in it, as opposed to a signal’s fundamental and harmonics, which occupy discrete positions within the frequency spectrum.
In the course of all measurements with test instrumentation, noise is “bad,” whether it appears in the noise floor, below which signals cannot be displayed, or it is of a higher-level such as RF interference at the same frequency but at an amplitude sufficient to block the signal of interest.
One source of noise consists of actual fluctuations in the signal being measured. Since this noise is an intrinsic part of the signal and always at the output of the signal source, it can be successfully mitigated by bandwidth limiting or by signal averaging. Using a Tektronix MDO 3000 series oscilloscope, this is how it is done:
To demonstrate these two techniques, first we use a BNC cable to connect the output of the internal arbitrary function generator to one of the analog channel inputs. Then press AFG. This brings up the default sine wave. By pressing the waveform soft key, any of 13 different waveforms can be selected and shown in the display. The sinewave trace is thin and sharp, indicating that it is free of noise insofar as possible.
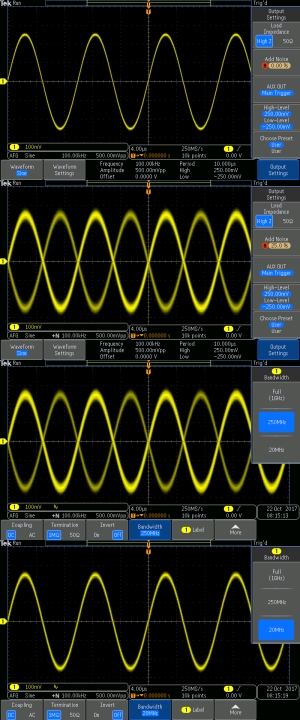
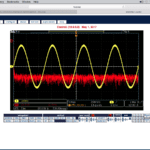
Next, for this demonstration, press the output settings soft key, which brings up the corresponding menu. The second category is Add Noise, which is accomplished by turning Multipurpose Knob a. Bring the noise component up to 25%. Notice this causes a loss of triggering, so the waveform as displayed no longer corresponds to the function at the channel input. Now we’ll apply bandwidth limiting and see if we can mitigate the noise that has been intentionally added to the signal from the AFG.
First, we cut the bandwidth to 250 MHz. As you can see, a portion of the noise is eliminated. Further limiting the bandwidth to 20 MHz restores the signal to close to the original, with no noise added.
You can see that bandwidth limiting is an effective means of cleaning up a signal that is partially obscured by noise. Of course, if the signal frequency places it beyond the reach of this reduced bandwidth, the method cannot be used. Instead, we turn to another method of noise mitigation.
With 25% noise again added to the sine wave, press Acquire. Then press the soft key associated with Mode and in the Acquisition Mode menu, press the soft key associated with Average. Multipurpose Knob a adjusts the number of cycles that are averaged to comprise the display. This number of cycles ranges from a low of two to a high of 512.
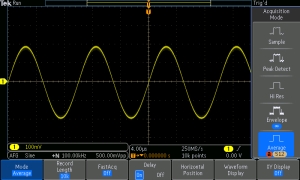
Averaging 512 cycles yields a clear and relatively stable waveform. That happens because noise, consisting of random, non-periodic fluctuations, cancels out and is eliminated in the display when a sufficient number of waveforms are averaged.
Radio frequency interference (RFI) is an entirely different source of noise. It can be minimized by shielding, filtering or lengthening the distance between the source of the interference and your test setup.
At one time, the RF environment was relatively quiet except for the occasional lightning bolt. That is no longer the case. Sources of RFI include fluorescent ballasts, variable frequency drives, switching power supplies and electric motors with brushes that arc where they contact commutators. RFI can be local, particularly within an industrial facility, or it can be far away, sometimes emanating from a radio broadcaster operating beyond its allocated band.
RFI can be radiated and received when some part of the equipment being tested or some part of the test instrumentation itself acts as an unintended antenna. RFI that is generated within electrical equipment can feed back through the power supply, enter premises branch circuits and feeders, and become problematic in a lab or shop, obscuring electrical signals. Fortunately, noise propagated in this way does not travel too far since it is attenuated by the series inductance of utility conductors. If this did not happen, the entire electrical grid would be compromised.
A frequent source of noise, broadly defined as electrical energy that is not part of the signal to be imaged, is radiated between and among closely-spaced media, especially when the adjacent runs are long. Mitigation methods include rerouting the cables, placing them in separate grounded metal raceways, and using twisted-pair cabling in conjunction with differential signaling. This is an advantage in Ethernet.
As outlined above, noise becomes a greater problem when the signal-under-test is higher in frequency. Lower capacitive reactance in parallel and higher inductive reactance in series in a transmission line combine to attenuate the signal, sometimes dropping it below the instrument noise floor. Paradoxically, shielding is less effective as a way of inhibiting electromagnetic coupling at lower frequencies. A consistent evil-doer is the ubiquitous power transformer, which emits copious 60-Hz electromagnetic radiation in all directions with little regard for the best-intentioned grounded shielding.
Then there is the issue of characteristic impedance. If two devices are connected by a transmission line, let’s say coaxial cable, it is essential that the impedance at both the output of the transmitting device and the input of the receiving device, and also the characteristic impedance of the transmission line, be matched (i.e. the same, equal). If these impedances do not match, there will be harmful reflections and collisions of data bits, which will degrade communication between the devices.
Coaxial cable, like Cat 5e, 6a and other unshielded twisted-pair (UTP) cable, is supplied by the manufacturer in specific characteristic impedances. It is a simple but necessary procedure to match impedances. Characteristic impedance cannot be directly measured using an ohmmeter, with the conductors at the far end either shunted or open. Characteristic impedance has nothing to do with the length of the run. It is best measured using an expensive instrument known as the time-domain reflectometer. For a noise-free installation, however, it generally suffices to rely on the cable’s labeling as supplied by the manufacturer.

Leave a Reply
You must be logged in to post a comment.