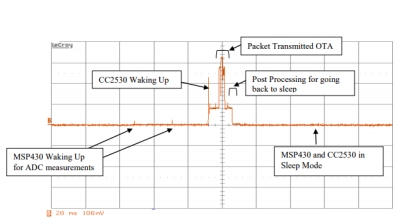
Integrals come in handy in measuring power consumption when that consumption is intermittent or corresponds to a dissipation vs. time function that is irregularly shaped. The classic example is that of

a controller that wakes up every second or so. You can, of course, use single-shot capture to get the current waveform when the controller wakes up. But suppose you want to calculate the total energy used over time. Mostly the processor sits in sleep mode. It might power up every two seconds.
The brute force method is to divide the captured wake-up current consumption waveform into easily estimated intervals and total them up. To do a thorough job you would record several such wake-up intervals and get an average dissipation.
But there is an easier way of conducting this process using an oscilloscope’s Integral function. The integral function basically computes the area under a captured curve so there is no eyeballing or visual estimates involved.
Scopes that incorporate math functions usually include an integration function. The usual technique is to plot the integral of the source using the trapezoidal rule, that is:
![]()
where I = the integrated waveform, Δt = point-to-point time difference, y = scope source channel, c0 = an arbitrary constant, and i = data point index.
Scopes allow you to typically display this amount overlayed on the curve of the parameter being integrated. Also note that the curve displayed when the integration button is pressed is really the peak value of the integral curve, not the total area.
The typical way of measuring total power consumption is to insert a low-valued precision resistor in the power supply, then measure the voltage drop across it. (The more straightforward approach is to use scope current probes in series with the DUT, but these probes tend to be expensive.) With the integration function selected, the scope scale settings are adjusted to display the integral waveform like the measured signal. Note, however, that the integral curve will have different units than the integrated parameter, in this case, volt-seconds or perhaps microvolt-seconds.

On a modern scope with cursors, we can set cursors at the starting and ending integral value to get the delta y value exactly. Also note if you display the integral function over numerous current pulses you will note it keeps rising as it accumulates sleep current. Some scopes will provide an Offset key or softkey that lets you enter a dc offset correction factor for the input signal. A small dc offset in the integrate function input (or even small oscilloscope calibration errors) can cause the integrate function output to ramp up or down. This dc offset correction lets you level the integration waveform.
The volt-second unit of integration (or mV-sec, μV-sec, etc., depending on scaling) means if you spread the consumption over one second it would average that number of volts over that second. Note that this is not a unit of energy. To get energy consumption, one needs to use the Ohm’s law relationship for power and voltage. But first, the volt-second number is multiplied by the number of wake cycles/second to get a number in units of just volts. Then, knowing the value of the precision resistor used in the measurement, we can calculate a power dissipation.


Leave a Reply
You must be logged in to post a comment.