Mixed-domain oscilloscopes and mixed-signal oscilloscopes differ significantly in how they display waveforms. Both are useful because they permit users to simultaneously view different electrical aspects of equipment under investigation. The MDO displays a single signal simultaneously in the time and frequency domains, demonstrating how they change together.
The MSO displays two different signals in the same timescale. These signals, applied to separate channel inputs, could be the dc output of a power supply and a digital output from the same equipment. Both signals display simultaneously in real time. That way, digital anomalies could be attributed to fluctuations in the output of an intermittently faulty power supply or perhaps to line voltage variations.
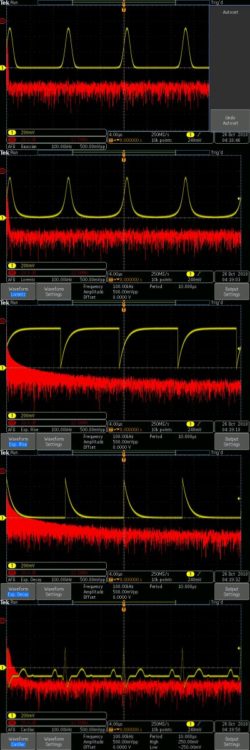
To see how a mixed domain oscilloscope works, we’ll connect the internal arbitrary function generator output on the rear panel to an analog channel input on the front panel of the oscilloscope, using a BNC cable. When the default sine wave is displayed, press Math>FFT and the Menu Off button.
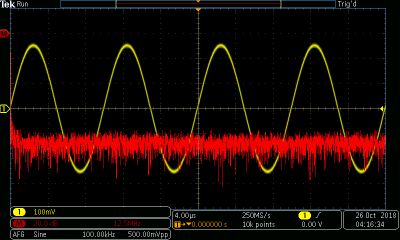
The sine function is unique among waveforms, with all its power concentrated in the fundamental, as shown in the frequency domain. The fundamental is a sharp spike at the left of the display. The irregular trace below the X-Axis is the noise floor of the instrument. It arises from thermal activity in components and conductors and is intrinsic to the oscilloscope and cabling.
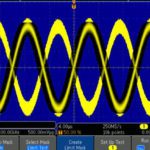
Another unique aspect of the sine wave is the fact that its rate-of-change and amplitude are inversely related. At negative and positive peaks, the graph that displays indicates that rate-of-change has slowed and, for an instant, stopped altogether. And when amplitude is least, as the trace crosses the X-axis, rate-of-change is greatest as the line becomes momentarily vertical. This is what a sine wave does and that makes it ubiquitous in nature and in human-made electronics. As amplitude approaches maximum and minimum, reduced force retards the rate of change.
The square wave, in contrast, has a constant and fast rate of change between its high and low levels. The non-sinusoidal periodic square wave is characterized by the fact that the amplitude alternates at a fixed frequency between unchanging high and low levels. Minimum and maximum amplitudes have the same duration, so the duty cycle is a constant 50%. Unlike the sine wave, as can be seen in the frequency domain, the square wave generates prodigious harmonics.
A pure square wave alternates instantly between high and low states, with no overshoot or ringing, which is known as the Gibbs phenomenon. In electronic circuits, ringing is generally undesirable. These transients sometimes exceed circuit rating limitations, and exhibit multiple threshold crossings.
What is noteworthy about the square wave, as can be seen in the frequency domain, is its immense spectral distribution of power. The amplitude of harmonics in the logarithmic frequency domain display rivals that of the fundamental. (Actually, as a matter of nomenclature, the fundamental is considered the first harmonic, and we take it from there.)
Harmonics are generated by the extremely fast rise and fall times of square and similar waves. Even- numbered harmonics cancel with respect to the fundamental, so the odd harmonics are more problematic in terms of power quality, especially triplen harmonics. They are defined as the odd multiples of the third harmonic, that is to say 3rd, 9th, 15th, 21st and so on. The higher the number, the weaker, because the power in the harmonics declines as with distance from the fundamental. This is clearly graphed in the frequency domain display.
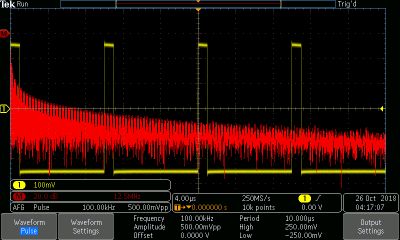
The pulse wave likewise is rich in harmonics. It resembles the square wave but may have a duty cycle other than 50%. (The square wave may be considered a special case of the pulse wave.)
The average amplitude of a pulse wave depends upon its duty cycle. This is the basis for pulse width modulation (PWM), which is used by, among other things, variable-frequency drives (VFD) to control the speed of ac induction motors.
That is just one example. The average voltage and current fed to any load can be varied by controlling the duty cycle of a pulse wave at a rate that is appropriate for the load. For an electric stove, it is several times per minute. For a dimmer-controlled lamp it is 120 Hz. For a motor drive, it is in the 10 kHz range. For an audio amplifier or computer power supply, we are looking at 100 kHz, more or less.
PWM is a highly efficient control method. When the switch is off, there is no current through it and when it is on, there is no voltage drop across it. Therefore, except during very brief transitions, there is minimal power loss.
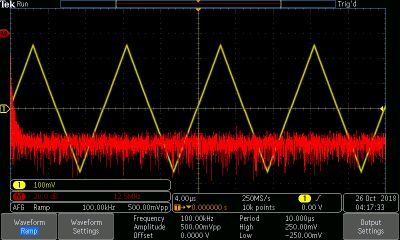
PWM techniques are also used to convey data over communication links. The ramp wave is an asymmetric triangle wave that is midway between a conventional sawtooth wave, which ramps upward and then abruptly drops, and the inverse sawtooth wave, which rises abruptly and then ramps downward. All these waves are closely related, with variations in their geometry relative to the X-axis.
Lacking abrupt rise and fall times, the ramp wave as it appears in the frequency domain has less harmonic content than the square and pulse waves, but more than the sine, which ideally has none. A sawtooth wave was used in analog TV and CRT-based oscilloscopes to control horizontal deflection.
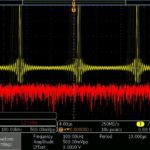
Noise is a broadband phenomenon, so in the frequency domain there is strong activity observed throughout the span.
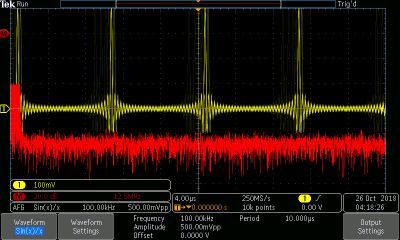
Sin(x)/x is the most accurate among several interpolation methods that complete the sampling and digitation process within a digital sampling oscilloscope. Provided the Nyquist Theorem is observed, the analog waveforms at the input channels are reproduced exactly.
Gaussian, also known as the normal distribution, is a frequently seen continuous probability distribution curve that approximates the distribution of quasi-random events.
The Lorentz waveform is used in modeling and derives from quantum effects.
Exponential Rise has nonlinear segments with abrupt transitions preceding the ensuing cycles.
Exponential decay has nonlinear segments with abrupt transitions preceding the following cycles.
The Cardiac Waveform is non-dynamic. It is used as a standard in testing, calibrating and verifying heart monitoring equipment for healthcare facilities.
The Fast Fourier Transform was developed in the 1960s. It has simple and easy to use algorithms that enable translation in both directions between the time domain and frequency domain display of a signal. Previously, these processes of analysis and synthesis required lengthy mathematical operations. The Fourier Transform was developed in the context of heat transfer by Joseph Fourier in 1825. He demonstrated that certain functions could be expressed as infinite sums of harmonics.
Today’s digital storage oscilloscopes, In the Math mode, perform Fast Fourier Transforms instantly when the user presses the appropriate soft key. An MDO oscilloscope displays time and frequency domain representations in a single display. The spectrum analyzer, while not able to display signals in the time domain, is optimized to do spectral analysis in the frequency domain. High bandwidth and extensive features enable users to assemble a vast amount of information pertaining to a signal at the input, and this information is helpful in troubleshooting existing equipment and systems as well as evaluating and debugging new prototypes.


Leave a Reply
You must be logged in to post a comment.