The roots of the venerable Moku:Lab, Moku:Go and Moku:Pro test gear from Liquid Instruments can be traced back to a sophisticated interferometer set to orbit the earth. As part of his PhD work, Liquid Instruments CEO Daniel Shaddock documented the design of the control system for the LIGO mirror, which had to be stabilized at the nanometer level.
LIGO (laser interferometer gravitational observatory) is a vast instrument intended to detect gravitational waves traversing our solar system. Field-programmable gate arrays (FPGA) play a prominent role in LIGO’s signal-processing. Shaddock’s extensive experience in gravitational wave detection projects prepared him for the creation of Liquid Instrument’s Moku:Lab and its successors, Moku:Go and Moku:Pro. A central component in all of them is the FPGA.

An FPGA is totally volatile, meaning that it loses all computing capability and functionality each time it powers down. But ordinarily, it is rebooted and the current programming is restored by means of an external IC without human intervention within a few seconds of power up. The FPGA is reconfigured each time it powers up using a hardware description language in the manner of an application-specific integrated circuit (ASIC). In earlier times, hand-drawn circuit diagrams specified the configuration but wiring complexity now force the use of electronic design automation tools.
In 2012, logic blocks and associated wiring were combined with embedded microprocessors and related peripherals to constitute autonomous systems on a chip, any of which could be field reprogrammed. Recent advances have empowered FPGAs to a point where they can use real-time parallel computing to implement the processing required for test and measurement equipment. These versatile devices, moreover, can be instantly reconfigured, enabling a single instrument such as Liquid Instrument’s Moku:Lab to switch between functioning as the oscilloscope, spectrum analyzer, frequency response analyzer and lock-in amplifier.
The FPGA is able to synthesize any of a great number of circuits thanks to its large number of internal gates and more complex devices, augmented by an extensive wiring network. Liquid Instruments has developed a format whereby the user can touch the screen of the networked iPad and instantly convert the instrument to any of several virtual sub-instruments, with waveforms and accompanying data displayed in the iPad screen.
When Liquid instruments first launched Moku:Lab, it could synthesize only three virtual instruments. Now there are twelve, with more on the way.
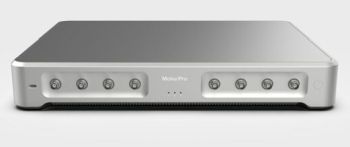

To begin using the Moko:Lab virtual instruments, the user goes to the iPad and to the Select Your Instrument page, then touches the icon pertaining to the desired instrument. The possibilities are:
Waveform generator
Frequency response analyzer
Arbitrary waveform generator
Data logger
PID controller
Digital filter box
Phase meter
Laser lock box
Spectrum analyzer
Lock-in amplifier
Then touch Go!
A large icon at the bottom of the iPad screen indicates which instrument has been selected, along with some parameters. For example, for oscilloscope (running), the screen notes that you can capture and display signals at a rate of up to 500 MS/sec, perform advanced waveform measurements and upload data to the cloud.
After pressing Go! the user is taken to the oscilloscope screen, which displays one or two waveforms depending on what is present at the inputs. On the right side of the iPad screen are, for inputs One and Two, typical benchtop oscilloscope parameters: Scale, Offset, Coupling, Impedance and Probe. At the bottom, you can go to Math and see a Fast Fourier frequency domain display.
A subsequent screen permits the user to access Acquisition Mode, Interpolation, Averaging, Persistence (On and Off) and timebase, with scale and offset. The next screen permits the user to select among more parameters: Frequency, Amplitude, Offset, Phase and Duty cycle.
Back to the main oscilloscope screen: It is a simple matter to perform quick measurements. Cursors can be linked to either channel, and they can be used to measure voltage or time. By touching Save Data, you can save waveforms and measurements to local files, Dropbox, Mail, an SD card, iCloud or the iPad clipboard. Toggling on Math lets the user access an FFT frequency domain display of the waveform.
So much for the oscilloscope. Now consider the Frequency Analyzer. While using the Oscilloscope and at the left side of the page, touch Switch Instruments. Select an Instrument appears in the iPad screen. Touch FRA (Frequency Response Analyzer). As in the oscilloscope, a variety of settings are available at the right side of the screen. In the main screen for each channel there are two curves. One is for the input and the other is for the output. That is how a transfer function is measured over a range of frequencies. As in the oscilloscope, cursors are used to obtain precise measurements. And also as in the oscilloscope, data can be saved to local files, Dropbox, Mail, SD card, iCloud or clipboard.
So the Frequency Analyzer is quick and easy to use. Ditto for the Spectrum Analyzer. Here again, go to the main Frequency Response Analyzer page>switch instruments>select an instrument>Spectrum Analyzer. For precise measurements, use cursors.

Leave a Reply
You must be logged in to post a comment.