• Skip to primary navigation
  • Skip to main content
  • Skip to primary sidebar
  • Skip to footer
  • Advertise
  • Subscribe

Test & Measurement Tips

Oscilloscopes, electronics engineering industry news, how-to EE articles and electronics resources

  • Oscilloscopes
    • Analog Oscilloscope
    • Digital Oscilloscope
    • Handheld Oscilloscope
    • Mixed-signal Oscilloscope
    • PC-based Oscilloscopes – PCO
  • Design
  • Calibration
  • Meters & Testers
  • Test Equipment
  • Learn
    • eBooks/Tech Tips
    • FAQs
    • EE Training Days
    • Learning Center
    • Tech Toolboxes
    • Webinars & Digital Events
  • Video
    • EE Videos
    • Teardown Videos
  • Resources
    • Design Guide Library
    • Digital Issues
    • Engineering Diversity & Inclusion
    • Leap Awards
    • White Papers
  • Subscribe
You are here: Home / Featured / Why does the Fourier Transform provide apparently inaccurate results, and what can I do about it? part 1

Why does the Fourier Transform provide apparently inaccurate results, and what can I do about it? part 1

January 23, 2024 By Rick Nelson Leave a Comment

This multipart series will review the discrete Fourier Transform and describe how to avoid common problems when transitioning from the time to frequency domain.

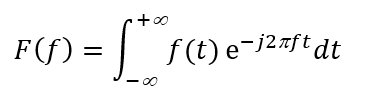
A recent post on phase noise discussed expressing a function of time as a function of frequency. The Fourier Transform is the well-known road from the time domain to the frequency domain:

My data is in the form of discrete data points instead of a continuous integrable function.
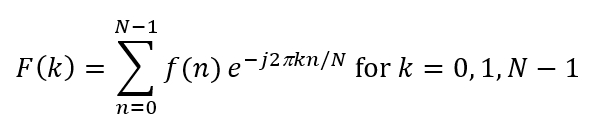
That’s right. In an engineering environment, you will undoubtedly have discrete data sets that you obtained using an oscilloscope or data-acquisition system. If you have N discrete samples representing f(n), then you can use the Discrete Fourier Transform (DFT) to return N data points representing F(k):

In this multi-part series, we will transform some sample data, examine some apparent aberrations in our results, and explore the role of spectral leakage in causing them. Finally, we will look at using windowing functions to improve accuracy.

Let’s begin by manually transforming a simple data set to see how the DFT works. First, from Euler’s formula, we can rewrite the DFT equation as follows:

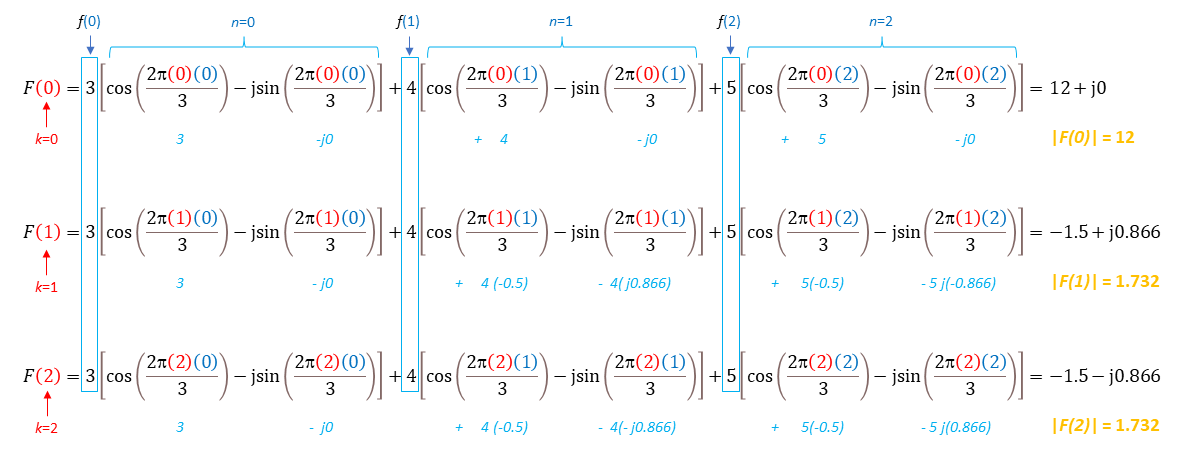
Figure 1 shows this calculation carried out for the data set f(n)=3, 4, 5. It highlights values for n in blue and k in red. Partial results are listed in light blue below each equation. The colors help illustrate that every calculation of F(k) involves every value of f(n). The final complex result is 12+j0, -1.5+j0.866, -1.5-j0.866. For most applications, we are interested in the complex numbers’ magnitudes, or absolute values: 12, 1.732, 1,732.

Figure 1. In this simple DFT calculation, values for n and k are listed in blue and red, respectively, while the magnitudes of the complex F(k) values are indicated in orange.

I see this could get tedious.

The DFT is computationally intensive and can be time-consuming even for a computer. Consequently, many Fast Fourier Transform (FFT) algorithms have been developed to speed execution.

By the way, how do we extract frequency information from the result?

Each equation in Figure 1 represents a “bin” that can correspond to frequency, but the DFT itself doesn’t add any useful context—it doesn’t ask for input timing information, nor does it generate any explicit information about frequency. FFTs that you’ll find on high-end oscilloscopes handle all the housekeeping for you — you just display your time-domain signal, push the FFT button, and the scope automatically generates the appropriate amplitude vs. frequency scale.

What do I need to run FFTs on my laptop?

You can always write a program that executes the DFT equation or an FFT algorithm yourself, but your best bet is engineering software such as MATLAB or LabVIEW. In addition, Microsoft Excel has a limited ability run FFTs — not elegantly, but in a way that helps answer your question about how to get frequency data from the output.

Can we use Excel to verify our manual calculations from Figure 1?

We cannot. Excel uses a version of the FFT that requires that N be a power of 2. You can, however, find online DFT calculators that can do that — click here, for example.

How do I set up a realistic example?

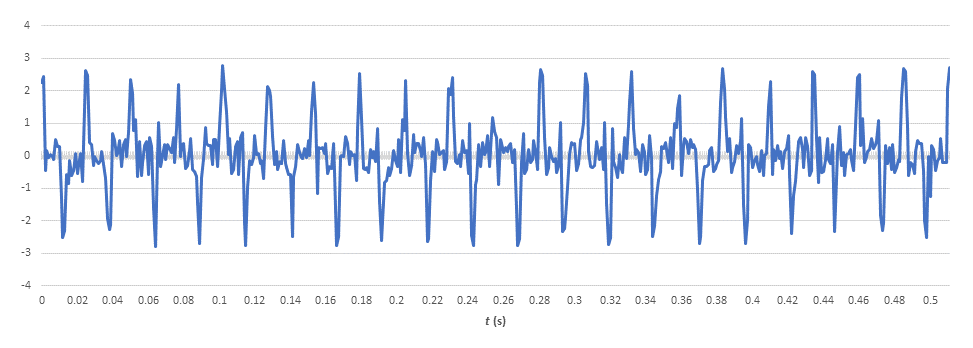
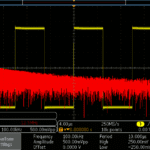
I’ll demonstrate by setting up a FFT calculation for the time-domain waveform in Figure 2, which includes 512 samples spanning times t ranging from 0 msec to 511 msec.

Figure 2. This function represents 512 samples spaced 1 ms apart.

First, we set up a spreadsheet as shown in Figure 3, with the six column headings as shown.

Figure 3. Follow steps 1 and 2 in red to check whether the Excel data-analysis package is installed.

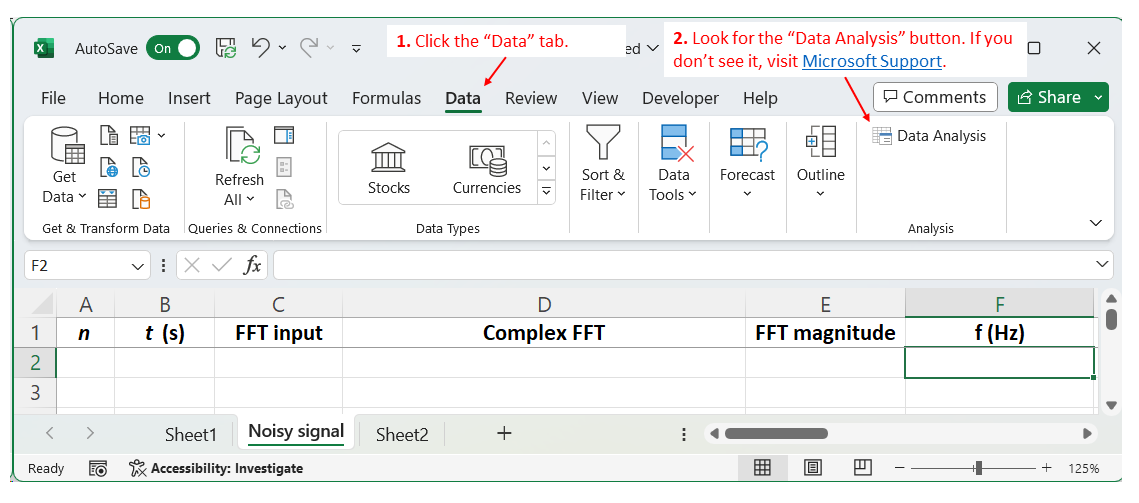
It looks like column F has the frequency information I’ve been asking about, right?

Right. We’ll go through the details of filling out the spreadsheet — especially column F — in part 2. You can take two simple steps now to make sure you can run FFTs on your own version of Excel. Click the “Data” tab and look for the “Data Analysis” button. If you don’t see it, visit Microsoft Support here to learn how to load the data-analysis tools.

Meanwhile, these videos highlight some oscilloscopes’ FFT capabilities:

  • Fast Fourier Transforms with an Oscilloscope (Keysight Technologies).
  • Basics of using FFT on a Tektronix TDS2000 oscilloscope (Tektronix)
  • HDO Using Spectrum Analyzer Mode (Teledyne LeCroy)

You may also like:

  • Integral of Sin(x)_x
    Subtleties of math functions in digital storage oscilloscopes
  • fraction fourier transform
    A fractional Fourier Transform? Yes, there is such a thing.
  • frequency domain square
    Basics of math functions on oscilloscopes
  • spectrum analyzer block diagram
    Basics of spectrum analyzers
  • degausser
    Gauss and his demagnetization circuit

  • Fast Fourier Transforms

  • Basics of Fourier transforms

Filed Under: FAQ, Featured Tagged With: FAQ

Reader Interactions

Leave a Reply Cancel reply

You must be logged in to post a comment.

Primary Sidebar

Featured Contributions

Why engineers need IC ESD and TLP data

Verify, test, and troubleshoot 5G Wi-Fi FWA gateways

How to build and manage a top-notch test team

How to use remote sensing for DC programmable power supplies

The factors of accurate measurements

More Featured Contributions

EE TECH TOOLBOX

“ee
Tech Toolbox: Internet of Things
Explore practical strategies for minimizing attack surfaces, managing memory efficiently, and securing firmware. Download now to ensure your IoT implementations remain secure, efficient, and future-ready.

EE TRAINING CENTER

EE Learning Center

EE ENGINEERING TRAINING DAYS

engineering
“test
EXPAND YOUR KNOWLEDGE AND STAY CONNECTED
Get the latest info on technologies, tools and strategies for EE professionals.
“bills

RSS Current EDABoard.com discussions

  • How to best test Electrolytic capacitors for premature failure reduced life?
  • Core loss in output inductor of 500W Two Transistor forward?
  • Disappearing clock
  • GanFet power switch starts burning after 20 sec
  • Colpitts oscillator

RSS Current Electro-Tech-Online.com Discussions

  • Can I use this charger in every country?
  • LED circuit for 1/6 scale diorama
  • Electronic board faulty?!?
  • using a RTC in SF basic
  • An Update On Tarrifs
Search Millions of Parts from Thousands of Suppliers.

Search Now!
design fast globle

Footer

EE World Online Network

  • 5G Technology World
  • EE World Online
  • Engineers Garage
  • Analog IC Tips
  • Battery Power Tips
  • Connector Tips
  • DesignFast
  • EDA Board Forums
  • Electro Tech Online Forums
  • EV Engineering
  • Microcontroller Tips
  • Power Electronic Tips
  • Sensor Tips

Test & Measurement Tips

  • Subscribe to our newsletter
  • Advertise with us
  • Contact us
  • About us

Copyright © 2025 · WTWH Media LLC and its licensors. All rights reserved.
The material on this site may not be reproduced, distributed, transmitted, cached or otherwise used, except with the prior written permission of WTWH Media.

Privacy Policy