Digital oscilloscopes are characterized by an acquisition menu, permitting the user to choose among modes and to select the record length, horizontal position and waveform, and to turn on or off Fast Acq, Delay and XY Display. We’ll look at each of these in turn.
The essence of digitalization is that points comprising a waveform represent samples. The analog-to-digital converter (ADC), the defining component in a digital oscilloscope, determines the rate at which samples are taken. It is regulated by the processor and also by an external clock, which is a square wave oscillator. The time between the sample points is known as the sample interval. Sample values are first stored in memory and then they are displayed to construct the waveform.
The sample intervals and waveform intervals do not always coincide. A consequence is that there are multiple acquisition modes, which affect the various ways in which sequentially acquired sample points comprise individual wave points. Acquisition modes are Sample, Peak Detect, High Resolution, Envelope and Average.
In the sample mode, the most basic type of acquisition, the oscilloscope automatically creates a waveform by saving one sample point during each waveform interval. For this one-to-one correspondence, a waveform at the oscilloscope input must be repetitive.
In the Peak-Detect mode, two waveforms are analyzed. The oscilloscope saves in its memory the minimum and maximum values to comprise two corresponding waveform points. Because Peak Detect mode requires the ADC to operate at a fast sample rate with a slow time base setting which results in long waveform intervals, the scope can capture fast signal changes. In Peak-Detect mode, the instrument can display fast transients at slow sweep speeds, such as when narrow pulses happen temporally distant from one another.
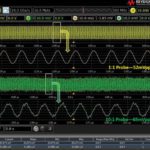
High-Resolution mode resembles Peak-Detect mode in that the ADC samples faster than required for a given time-base setting. If you look carefully at typical traces such as sine waves sent over from the internal AFG, you will see that some of them appear sharper than others. This is a measure of how much noise they contain. (In the frequency domain, noise appears as a noise floor fluctuating at a lower amplitude than the signal of interest. In the time domain, noise appears as a thickening or small irregularity in the trace.) At high frequencies, the signal contains more noise and in High-Resolution mode it is retained. In the High-Resolution mode, averaging is more effective in rejecting noise at low frequencies. Unlike Averaging mode, High-Resolution mode works on a non-repetitive signal.
Envelope mode resembles Peak-Detect mode, with a significant difference, which is that minimum and maximum waveform points are sampled from different acquisitions to form a waveform in memory that exhibits a minimum and maximum outside the envelope over time. Peak-Detect mode first acquires the record and this raw data is used to construct the envelope waveform. In looking at Envelope mode with the number of peaks adjusted to infinity, the trace of a simple sine wave taken from the internal AFG will be seen to be quite thick. This is not an indication of noise. It is a statistical variation in the 2,000 waveforms that contribute to the envelope as displayed. If we reset the AFG to Noise and then return to Envelope, this display is shown in a dramatic fashion.

Try it with different waveform numbers and AFG frequencies to get a sense of how envelope works. Average mode is useful in displaying a signal that is obscured by noise. Because most noise, especially thermal, is random, it is self-canceling when successive waveforms are averaged. In contrast, the repetitive signal is retained. The advantage over bandwidth limiting is that the acquisition frequency range is not reduced. The number of waveforms that are averaged can be set by the user, ranging from two to 512.
Besides modes, the record length can be adjusted, using the Multipurpose Knob a or the keypad. The number of points can be set by the user, from 1,000 to 10 million. (Remember that record length is not expressed in time, but in total points or samples.)
Because an oscilloscope can store only a limited number of samples, it is usually considered desirable to have a long record length. However, record length can work against you. It can be intentionally reduced to optimize performance in some applications. The maximum record length for a particular instrument is given in the specifications, but the user may want to adjust it downward for a sensitive application. Of course, you can’t go above the maximum, and if you go to zero, there is no display.
The sampling rate is determined by record length divided by time captured. Therefore, it may be necessary to reduce record length due to memory constraints, depending upon the frequency of the signal of interest.
Pressing the soft key associated with FastAc brings up the relevant menu. Fast Acq can then be toggled on, activating the Waveform Palette. Then, Multipurpose Knob a allows the user to choose among temperature, spectral, normal and inverted displays.
The purpose of FastAcq is to enable high-speed waveform capture, which is helpful in finding elusive signal anomalies. It reduces the dead time between individual waveform acquisitions, enabling the capture and display of runts and glitches. It also displays waveform phenomena at an intensity that reveals their rate of occurrence. This is equivalent to having a three-dimensional display, with a third Z-axis, which would be awkward in a flat-screen display.
The digital storage oscilloscope is capable of stopping and starting an acquisition and of storing a waveform in memory for later viewing and analysis. It is a simple matter to insert a flash drive into the USB slot on the front panel and save waveforms and/or instrument setups. The flash drive contents can subsequently be loaded into a computer (all of this is cross-platform), subjected to further analysis, be printed, emailed to colleagues or sent to tech help or to a publisher.
Even after the original signal no longer exists, the waveform can be measured and analyzed in the oscilloscope using Wave Inspector functions – measure, search, test, zoom, pan, and mark. Moreover, the oscilloscope can be made to stop automatically after an acquisition is complete or after a series of records has been converted into an envelope or average waveform. This capability is activated by pressing the Single Sweep button, usually located by the Start/Stop button near the triggering section.
XY mode is a fascinating and instructive excursion into the ultimate meaning of Cartesian Coordinates. To get a sense of it, press XY Display and toggle it on by pressing Triggered XY. Additionally, YT can be toggled on to show in split-screen format XY mode along with the conventional time-domain display.
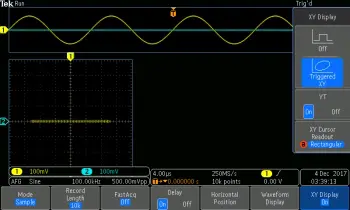
The digitized waveform at first consists of a series of dots located on Cartesian coordinates, the X- and Y-axes. Each of these dots is defined unambiguously. However, it remains for them to be connected to make a cogent display, where information is available not just for the discrete dots, but for any location along the trace. For this to happen, where one and only one digital realization is equivalent to the original analog input, the Nyquist sampling requirement must be met:
The sampling frequency must be twice the highest frequency contained in the signal. The signal must be periodic. It may be non-sinusoidal and therefore complex. In that event, as Fourier tells us, it can be decomposed into a series of perfect sine waves, which are harmonics that are integral multiples of the fundamental.
It is the component of the sampled waveform having the highest frequency that determines the minimum necessary sampling rate. Accordingly, the sampling rate depends not only upon the frequency of the fundamental but also upon the complexity of the wave as it appears at the analog input, subject also to the bandwidth of the oscilloscope. An instrument with lower bandwidth is equivalent to bandwidth limiting as a technique to suppress high-frequency noise, only rather than noise what is eliminated is information that may be of value.


Leave a Reply
You must be logged in to post a comment.